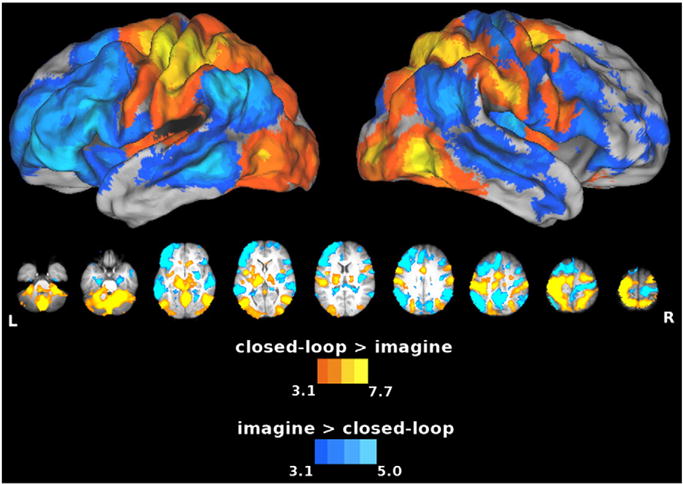
Fig. 4.

Areas showing increased activity for the closed-loop vs. imagine comparison. In this and subsequent figures, group statistical parametric maps were thresholded at Z > 3.1 (corrected clusterwise significance threshold p < 0.05). Warm colors show the closed-loop > imagine contrast, and cool colors show the imagine > closed-loop contrast. Closed-loop execution showed greater increases in activity in both the SPL and cerebellum with respect to imagery, emphasizing the importance of these areas in feedback control. On the other hand, imagery showed greater increases in activity in the IPL (Ag), left MFg, pre-SMA, MTg and dorsal striatum, areas that might be more involved in feedforward processes. Both dorsal (closed-loop)/ventral (imagery) and posterior (closed-loop)/anterior (imagery) divisions are evident here.
