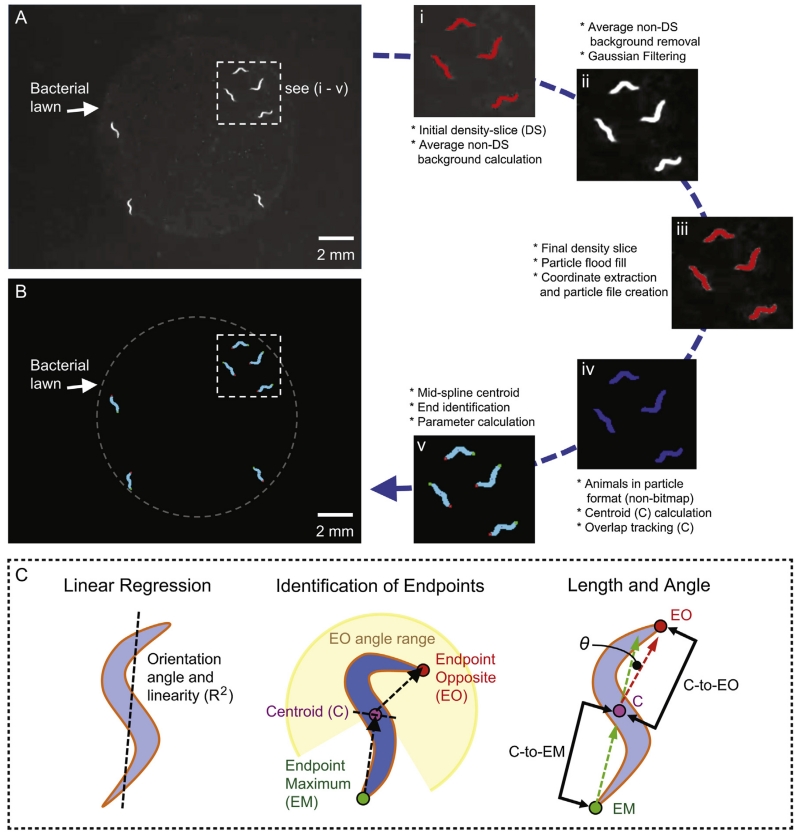
Fig. 2.
General overview of acquisition and processing of image data. Shown is a gray scale raw image of multiple animals acquired by the imaging system. Animals are easily recognized as light objects on dark backgrounds by dark-field illumination. The inset (3.5 × 3.5 mm) depicts sequential image processing steps (i–v) from the original raw image (A) to the final image (B) as described in Section 2. (C) Schematic of the orientation angle and linear regression analysis (left), the centroid and endpoint detection (middle), and length and kink angle determination (right). Briefly, we designed the following rundown analysis: (1) Overall angle of the animal by linear regression (−90 to +90, with 0° = 12 o’clock); (2) animal copied and rotated to +90° and linear regression recalculated to get Pearson’s R2 value (i.e. how “straight” the animal is). The rotation maximizes the number of χ steps; (3) the endpoint maximum (EM) (green) coordinate furthest from the centroid (C) position (purple); (4) the centroid (C) is relocated laterally into the middle of the animal based on the perpendicular angle between the endpoint maximum (EM) coordinate and the original centroid (C); (5) the endpoint opposite (EO) (red) particle coordinate furthest from the centroid in the opposite direction of the centroid–EM angle; (6) parameters calculated from a single frame include: “Kink” angle (Δ angle between EM-to-C, and C-to-OE); and “Length” (additive distance between C-to-EM, and C-to-OE). A more detailed analysis is described in Section 2. (For interpretation of the references to color in this figure legend, the reader is referred to the web version of this article.)

