Fig. 3.
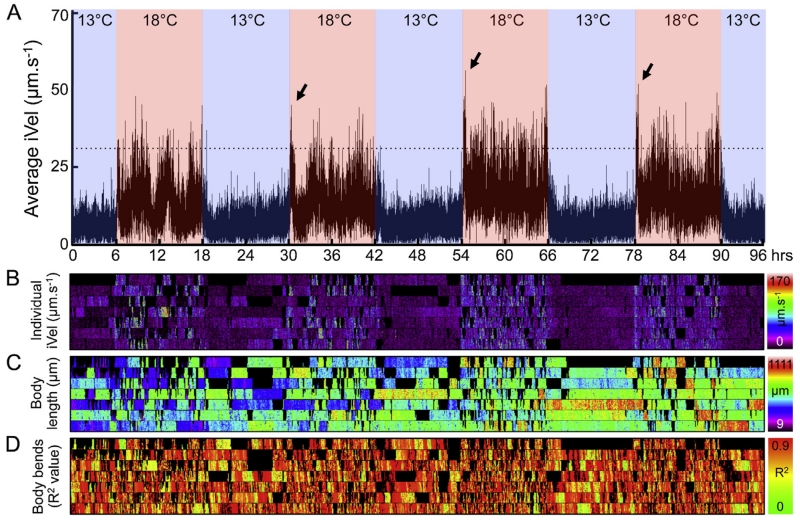
Locomotor activity rhythms and features related to movement and shape in wild-type animals during temperature cycles. (A) A line graph showing the average instantaneous velocity (iVel) of successfully tracked animal population (n = 7) during 4 days of temperature cycles of 13 °C:18 °C (12:12 h). The warm (18 °C) and cold (13 °C) phase of the cycle are depicted by red and blue colors, respectively. Sudden bursts in activity (startle response) are indicated with black arrows. Spatio-temporal maps of iVel (μm s−1) (B), body length (μm) (C), and the R2 value for linearity (degree of body bends) (D) of individual animals successfully tracked for about 30 s are shown. (For interpretation of the references to color in this figure legend, the reader is referred to the web version of this article.)

