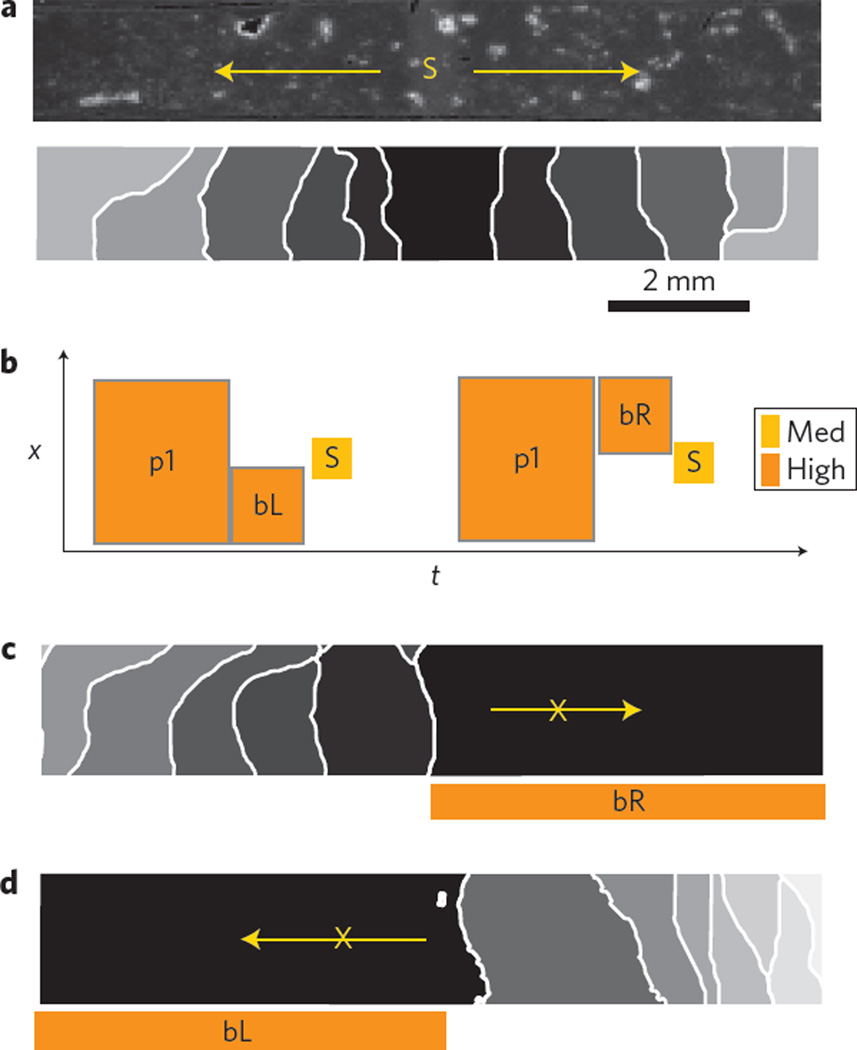
Figure 2. Optical control of cardiac wave direction.
a, Sample and applied light stimulus S, inducing bidirectional propagation. b–d, Schematic representation (b) of the applied light protocol in space and time (x–t) with pre-conditioning stimuli p1 and blocking stimuli bL and bR to set tissue refractoriness before stimulus S, resulting in a right-side (c) or a left-side (d) unidirectional block. Here p1 is 350 ms, bR and bL are 50 ms and S is 10 ms. Irradiance levels are high (1,200 W m−2) and medium (700 W m−2). Activation maps show isochrones at 100 ms spacing.

