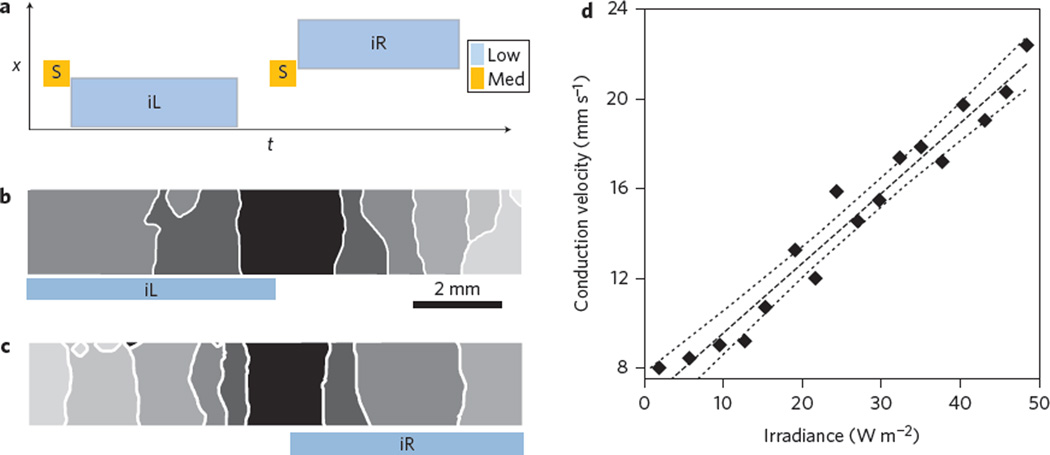
Figure 3. Optical control of cardiac wave conduction velocity.
a, Schematic of applied optical stimulation protocol in space (x) and time (t). b,c, Activation maps of controlled left-side (b) and right-side (c) increase of conduction velocity by light, indicated by the larger spacing of the isochrones. d, Relationship between conduction velocity and irradiance, with linear regression best fit (dashed line) and 95% confidence intervals (dotted lines). Results from nine independent experiments are shown in Supplementary Fig. 6. iR and iL are 500 ms. Isochrones are 100 ms apart. Irradiance levels for the stimulating pulse (‘Med’ in a) are 700 W m−2, with low irradiance varying between 0 and 80 W m−2 applied as shown in b and c. For b and c, see also Supplementary Movie 3.

