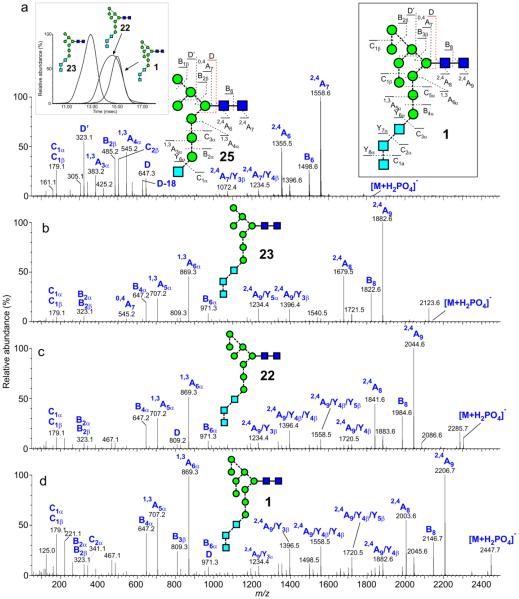
Figure 10.
Negative ion CID spectra ([M+H PO ]− ion) of: (a) Glc1Man7GlcNAc2 (25). (b) Glc3Man7GlcNAc2 (22). (c) Glc3Man8GlcNAc2 (23) and (d) Glc3Man9GlcNAc2 (1). Spectra b, c and d were from gp120 expressed in CHO cells in the presence of the α-mannosidase inhibitor NB-DNJ. Inset 1 to panel a shows the ATD profiles for Glc3Man7-9GlcNAc2, Inset 2 shows the fragmentation of Glc3Man9GlcNAc2 (1).

