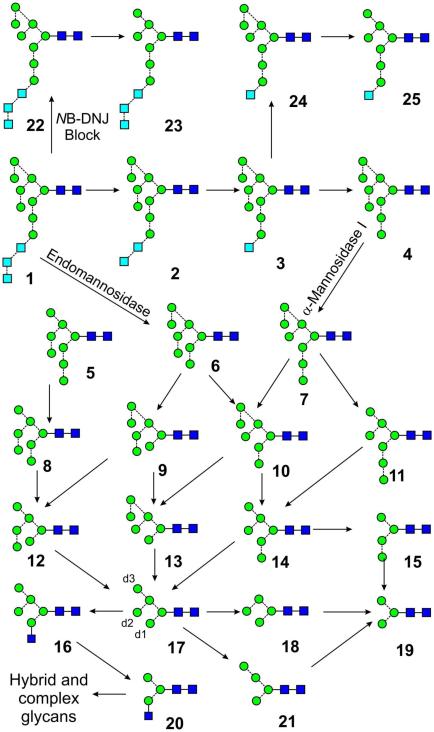
Scheme 1.
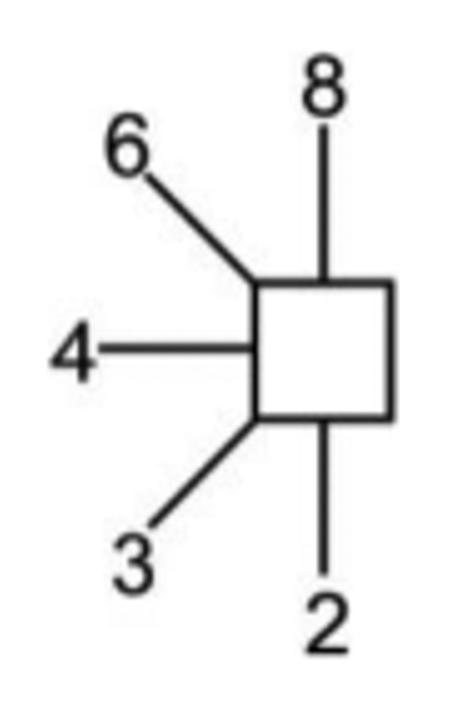
Biosynthesis of the high-mannose glycans. The arrows show the relationship between the various glycans but do not necessarily imply the existence of specific enzymatic pathways. Symbols used for the glycans are  = mannose,
  = GlcNAc and
  = glucose. Solid lines connecting the symbols are β-linkages, broken line are α-linkages. The angle of the lines shows the linkage position. For more information seey116.


