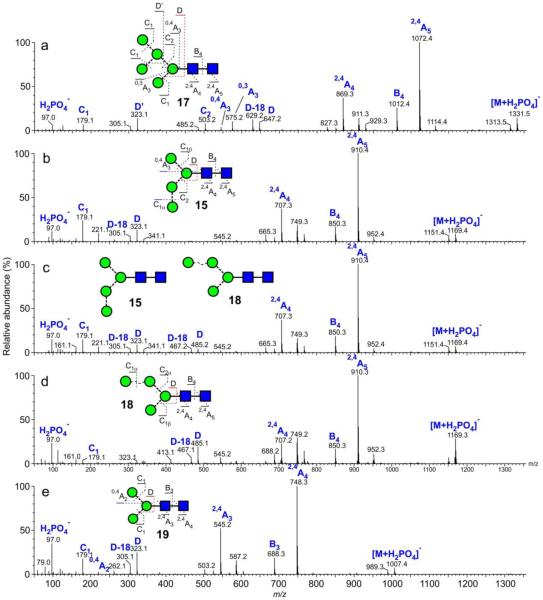
Figure 2.
Negative ion CID spectra ([M+H2PO4]− ions) of: (a) Man5GlcNAc2 (17, from gp120), (b) Man4GlcNAc2 (15, mobility-extracted, from gp120 as shown in Figure 4b), (c) Mixture of Man4GlcNAc2 (15 and 21 from gp120), (d) Man4GlcNAc2 (21, mobility-extracted, from gp120 as shown in Figure 4b), (e) Man3GlcNAc2 (19, from chicken ovalbumin). Symbols used for the structural diagrams in these and other spectra are as described in the legends to Schemes 1 and 2. Fragment ions are labelled according to the scheme proposed by Domon and Costello96.

