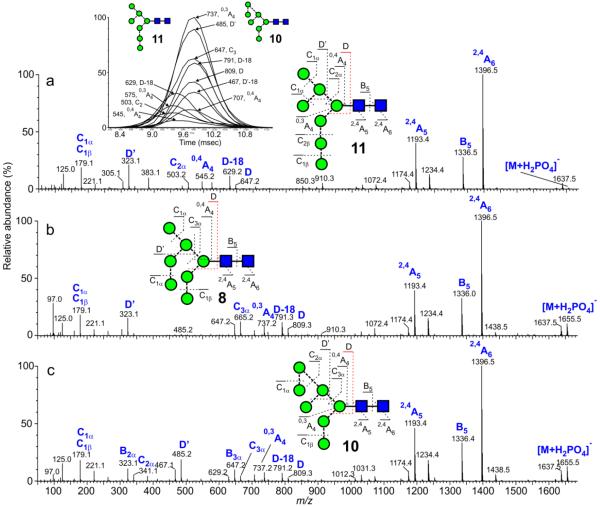
Figure 6.
(a) Negative ion CID spectrum ([M+H2PO4]− ion) of Man7GlcNAc2 (d1d1 isomer, 11, from porcine thyroglobulin). (b) Negative ion CID spectrum ([M+H2PO4]− 8, from gp120, (JRCSF)). Negative ion CID spectrum ([M+H PO ]− ion) of Man7GlcNAc2 (d1d2 isomer, ion) of Man7GlcNAc2 (d1d3 isomer, 10, from gp120). The inset to the first panel shows single ion plots of the 6-antenna-specific ions (smoothing algorithm, mean 2×2) showing the presence of the minor isomer 11. The spectrum in panel c was, thus, from the right-hand portion of the ATD peak.

