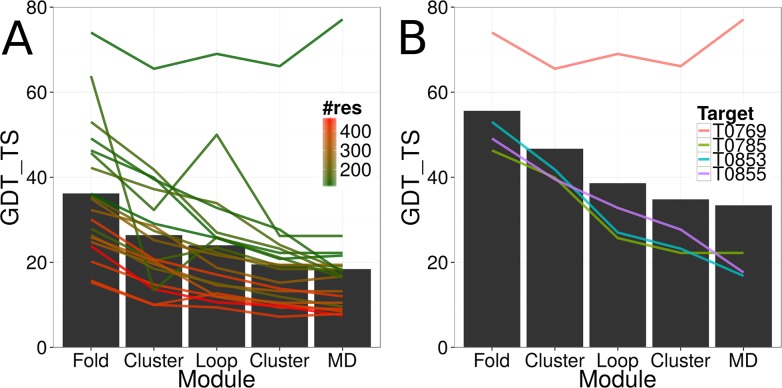
Fig 3. Model accuracy decay over the course of the protein structure prediction pipeline.
(A) The model accuracy decayed over the course of the protein structure prediction pipeline. The black bars show the average GDT_TS value of the most accurate model over all twenty regular targets after each pipeline module. The lines show the development of model accuracy for each target over the course of the pipeline. The coloring is according to the number of residues in the protein target. (B) Same as in (A) for four selected targets with a GDT_TS value of greater than 40% after the first clustering step.

