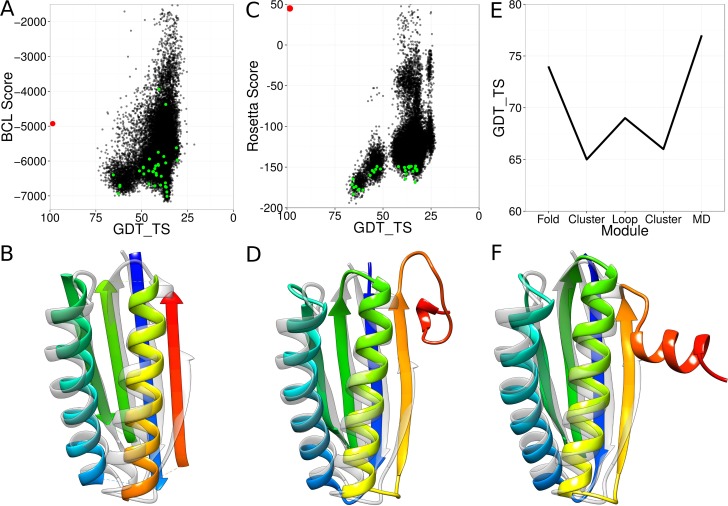
Fig 4. Case study of regular target T0769.
(A) Results for the low-resolution topology search. Each black dot represents one sampled model. The NMR structure is shown in red. The green dots are the cluster medoids selected after the topology search. (B) Most accurate model after the topology search (rainbow) superimposed with the NMR structure (grey). (C) Results for high-resolution refinement and loop construction. Each black dot stands for one sampled model. The NMR structure is shown in red. The green dots are the cluster medoids selected after the high-resolution refinement. (D) Most accurate model after the high-resolution refinement (rainbow) superimposed with the NMR structure (grey). (E) Development of the GDT_TS of the most accurate model over the course of the pipeline. (F) Most accurate model after the molecular dynamics refinement (rainbow) superimposed with the NMR structure (grey).

