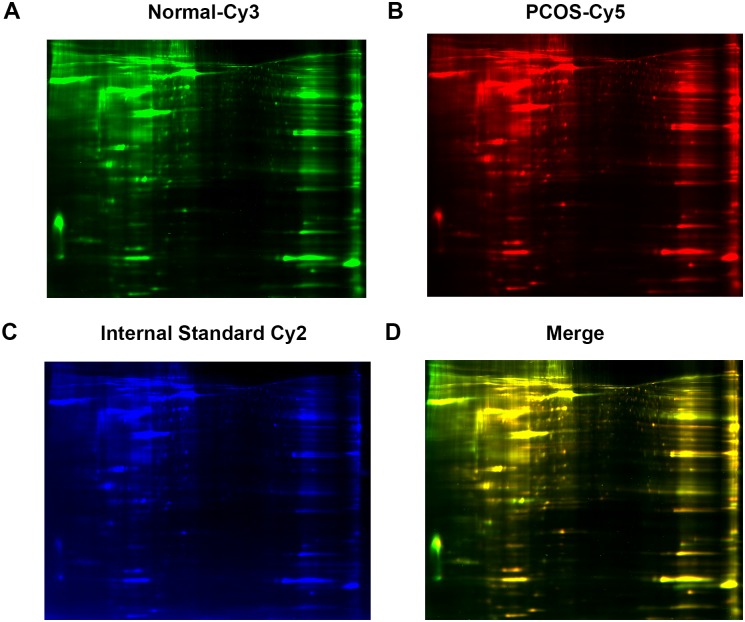
Fig 2. Protein analysis by 2D-DIGE analysis.
Ovarian tissues from patients with PCOS and healthy controls were analyzed for differential protein expression by 2D-DIGE. A total of 10 samples were analyzed in each group. Individual samples were labeled with Cy3 (A) and Cy5 (B). Pooled samples were labeled with Cy-2 as an internal control. The three labeled samples were then mixed and loaded into a 2D-PAGE gel for two dimension separation. The labeled proteins were visualized and scanned for imaging. An overlay of three dye-scanned images was obtained (D). One representative result from 10 individual samples is shown.

