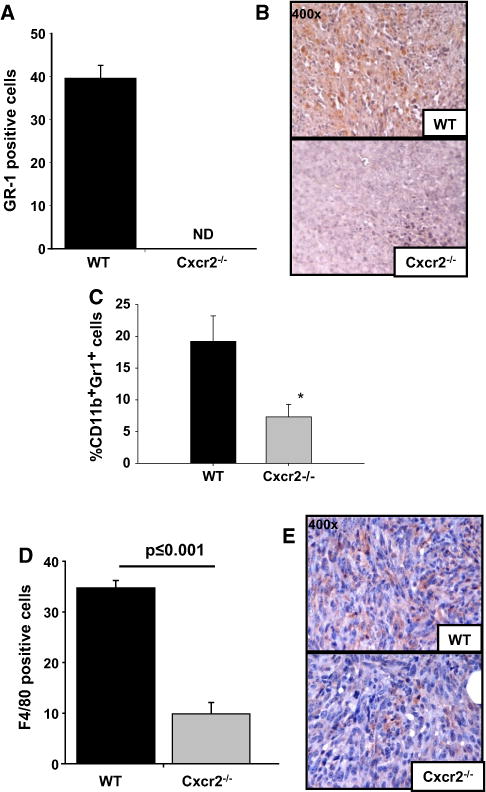
Fig. 6.

Tumor infiltration of inflammatory cells: a & b Quantification of Gr-1 (a), CD11b+Gr1+ MDSc (c) and F4/80 (d) staining to evaluate neutrophil and macrophage infiltration in tumors. Five fields were counted from each tumor for Gr-1 or F/480 positive cells (n = 5). Flow cytometric analysis was performed using CD11b and Gr1 antibodies (n = 5). The mean was calculated and mean ± SEM was graphed for each group. b and e Microscopic image of a representative section of tumor showing Gr-1 (b) or F4/80 (e) staining in tumors formed in wild-type or Cxcr2−/− mice
