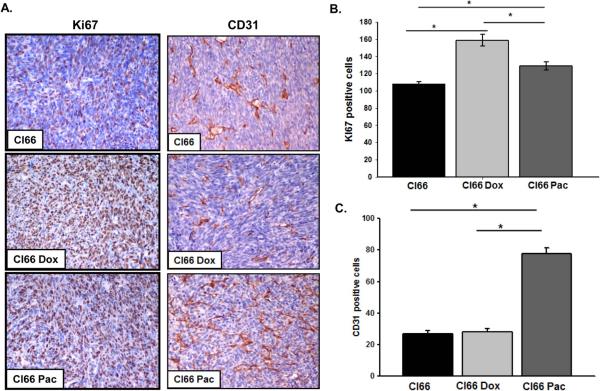
Figure 4. Tumors formed by drug-resistant cells (Cl66-Dox and Cl66 Pac) show higher proliferation and angiogenesis in comparison with tumors formed by parent Cl66 cells.
A) Immunohistochemical analysis of Ki67 and CD31 in tumors formed by Cl66, Cl66-Dox and Cl66-Pac cells in BALB/c mice. B) Quantification of Ki67 in tumors. Five different areas positive for Ki67 were counted for each tumor section and mean ± SE were plotted. Cl66 vs Cl66-Dox p < 0.001, Cl66 vs Cl66-Pac p < 0.001 and Cl66-Pac vs Cl66-Dox p = 0.002. C) Quantification of CD31 in tumors. Five different areas positive for CD31 were counted for each tumor section and mean ± SE were plotted. Cl66 vs Cl66-Pac and Cl66-Dox vs Cl66-Pac p < 0.001.

