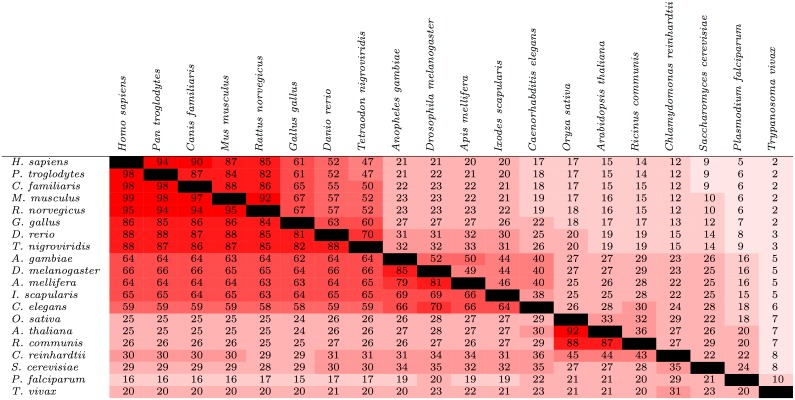
Fig 1. Conservation of phosphorylation sites (upper triangle) and protein kinases (lower triangle) among 20 species from a diverse range of lineages.
For a given pair of species, the values represent the percentage of phosphorylation sites or protein kinases found in at least one of the two species that were found in both species (the values C(SA, SB) described in the text). The cells are colored based on the value within; the closer the value is to 100, the brighter the shade of red.

