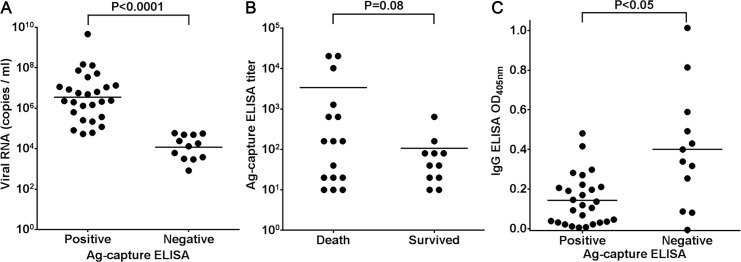
Fig 3. Correlation between the results of the Ag-capture ELISA and that of the viral RNA copy numbers or OD values of IgG ELISA.
(A) Correlation between the result of the Ag-capture ELISA and viral RNA copy numbers in the serum samples. The Ag-capture ELISA (x axis) and the viral RNA copy number determined by qRT-PCR (y axis) from each sample are plotted as dots. (B) Relationship between the titers of the Ag-capture ELISA and the patients' outcomes. The patients' outcomes (x axis) and the titers determined by the Ag-capture ELISA (y axis) from each sample are plotted as dots. (C) Correlation between the result of the Ag-capture ELISA and OD values of IgG ELISA. The results determined by the Ag-capture ELISA (x axis) and OD405 values determined by IgG ELISA (y axis) from each sample are plotted as dots. The mean of each group is indicated by a horizontal bar. The t-test was used to determine the level of statistical significance. The calculated p values are shown above the groups that were compared.

