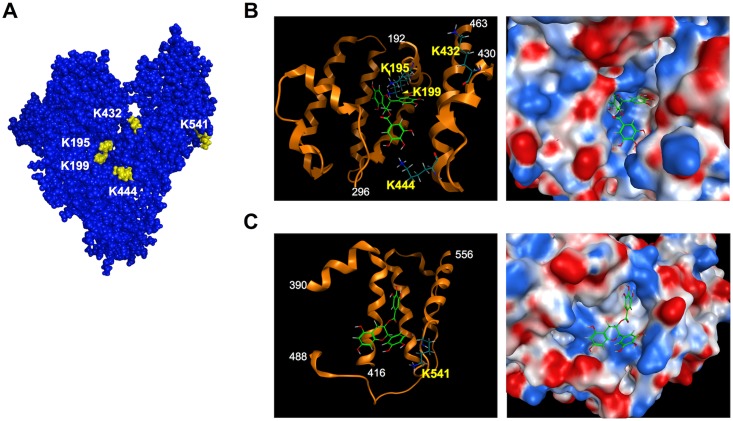
Fig 5. Docking simulations of EGCG to HSA.
(A) Surface representation of HSA with the lysine residues sensitive to oxidation highlighted in yellow. (B) Left, schematic representation of the EGCG binding site in subdomains IIA and IIIA. Ribbon model is colored in orange. Right, close up view of the EGCG-binding pocket from its entrance located in subdomains IIA and IIIA. The electrostatic potential is represented on a color scale from blue for a positive potential, white for neutral, to red for a negative potential. (C) Left, schematic representation of the predicted EGCG binding site in subdomain IIIB. Ribbon model is colored in orange. Right, close up view of the predicted EGCG-binding pocket in subdomain IIIB. In panels B and C, selected residues shown in stick and color-coded by atom type: carbon in dark green; oxygen in red; and nitrogen in blue. The electrostatic potential is represented on a color scale from blue for a positive potential, white for neutral, to red for a negative potential. The EGCG molecule is shown in stick and color-coded by atom type: carbon in right green; oxygen in red.

