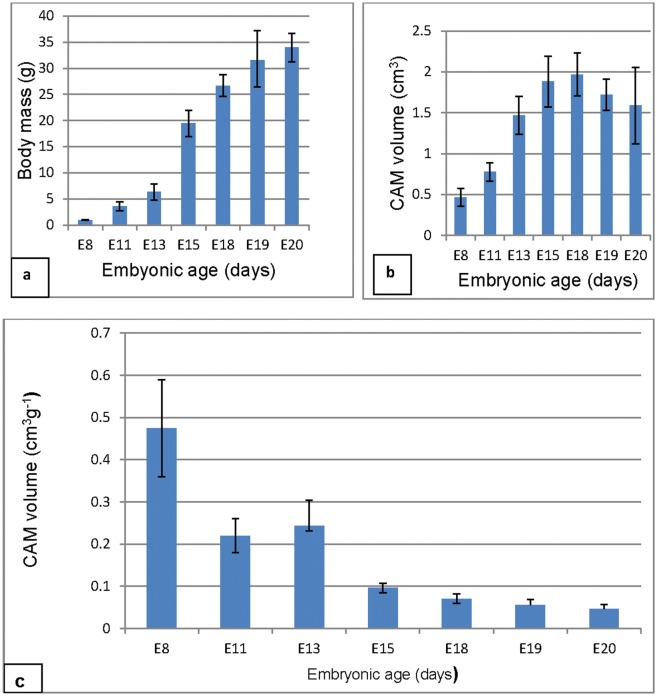
Fig 6. Bar graphs showing the variation in body mass (g), CAM volume (cm3) and body mass standardized CAM volume (cm3g-1).
a: Notice that body mass increases steadily between E8-E13, sharply between E13-E15 and then steadily between E15-E20, marking the three growth phases. b: The CAM volume increases fast between E8-E13, steadily between E13-E15 and then declined between E18-E20, the latter was thus a phase of regression. The phase of rapid CAM growth precedes that of embryonic growth. On Scheffé's test (p ≤0.05) CAM volume at E8 and E11 were significantly lower than at all the other subsequent days (asterisks). c: Body-mass standardized CAM volume decreased gradually through the entire period.

