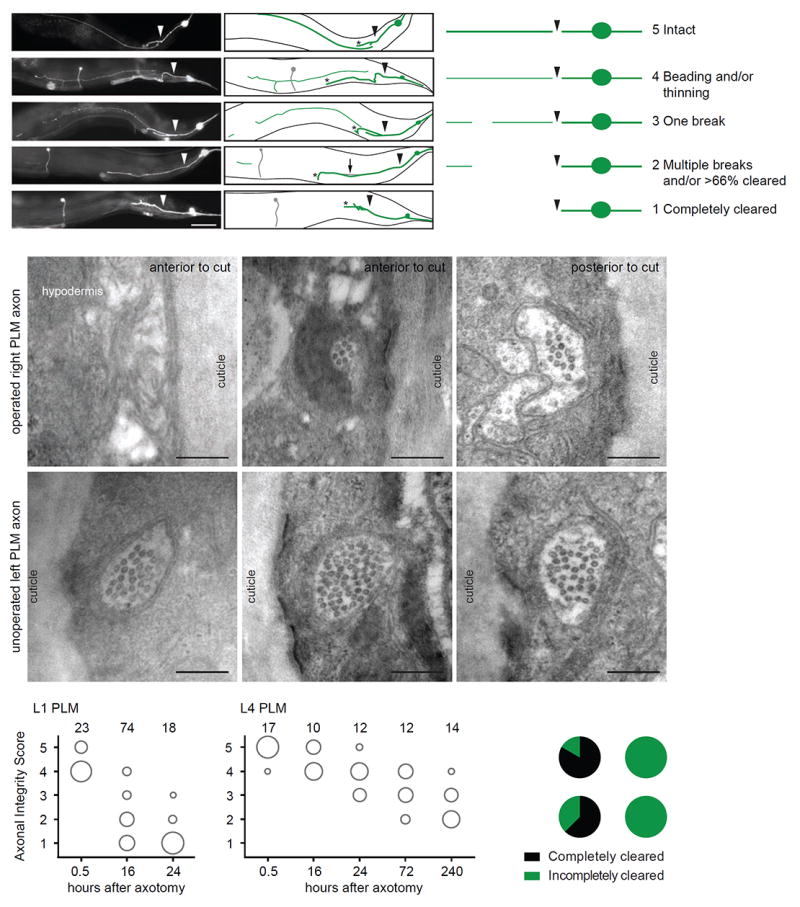
Figure 1. Characterization of axonal degeneration in C. elegans neurons following laser-induced axotomy.

(A) Representative images and schematics of progressive stages of axonal degeneration after axotomy in PLM neurons in different L4 animals expressing the zdIs5(Pmec-4∷GFP) transgene. Arrowheads indicate location of axotomy, asterisks indicate the end of the regrowing axon, and arrow points to a distal fragment. The PVM neuron, which also expresses GFP, is represented in gray. Scale bar indicates 50 μm. Degeneration of the distal fragment classified as the Axonal Integrity Score with a value of 1 (completely cleared) to 5 (intact). The panel on the right is a schematic representation of these phenotypes. (B-G) Representative EM images of the degenerating PLM axon on the axotomized side (B-D) compared to the intact PLM axon on the non-operated side (E-G). The axon is intact upstream of the injury site (D), whereas in regions distal to the injury site it becomes severely reduced in diameter (C) or completely absent (B) (see also Figure S1E-S1F). On the contrary, on the unoperated contralateral side, PLM is intact along its entire length (E-G). (H,I) Axonal degeneration at multiple time points post-axotomy of the PLM neurons at L1 (H) or L4 (I) stages. The area of each circle represents the proportion of data points that fall into that category; n value indicated on top of each bubble graph. Each animal was imaged at only one time point. (J) Pie graph representing the complete clearance (score of 1) after 24 hours in PLM and DD neurons in L1 and L4 animals.
