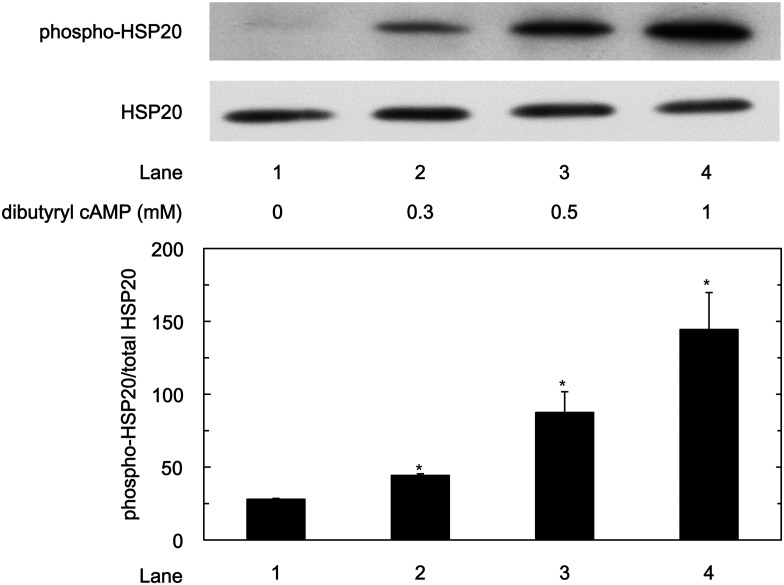
Fig 2. Phosphorylation of HSP20 by dibutyryl cAMP in HuH7 cells.
The WT-HSP20 overexpressed HuH7 cells were treated with the indicated concentrations of dibutyryl cAMP for 1 h. After treatment, the cells were harvested, and Western blot analysis was performed to determine the levels of phosphorylated HSP20. The lower bar graph shows the quantification data for the relative levels of phospho-HSP20 after normalization with the total HSP20 levels as determined by densitometry analysis. Each value represents the means ± SD (n = 3). *P<0.05, compared to the value of lane 1.

