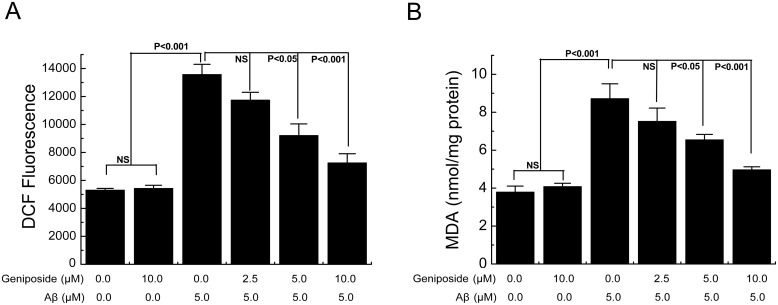
Fig 5. Effects of geniposide on the ROS and MDA levels in primary cultured cortical neurons.
The levels of DCF fluorescence intensity (an indicator of ROS generation (A)) and MDA production (B) were significantly elevated in Aβ1-42-treated neurons compared to vehicle-treated neurons, and partially restored in the geniposide-treated neurons in a dose-dependent manner. NS: non significance. N = 6 per group of cells. Studies were repeated four times and data were expressed as mean ± SEM of percentage of vehicle-treated cells.

