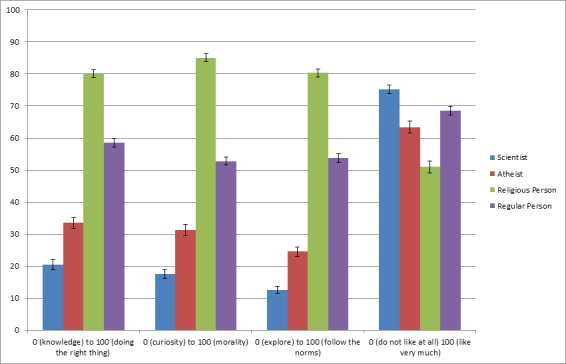
Fig 3. Evaluations of preferences and values, and likability, of the target groups (Study 10).

Within items, all means differ significantly from each other at p < .01 (Bonferroni adjusted); the only non-significant difference was liking of atheists versus regular persons). The third item was presented to participants from 0 (follow the norms) to 100 (explore), but reverse-scored in the current Fig. Error bars show standard errors of the mean.
