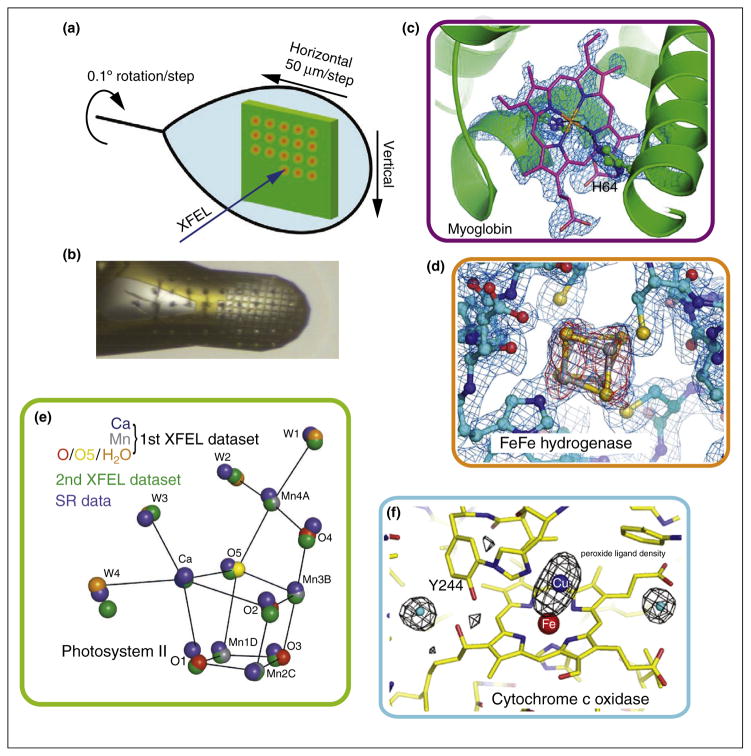
Figure 1.
Goniometer based crystallography experiments of metalloenzymes at XFEL sources. (a) Schematic of the experimental approach using a large crystal to collect still shots in a defined orientation with respect to each other, translating by 50 μm between shots and rotating by a small angle [11]. (b) Alternatively many small crystals mounted in a mesh or similarly can be used. The few μm focused beam leaves imprints on the sample [10]. (c) Omit electron density for the heme group in myoglobin obtained from measuring diffraction of several hundred individual small crystals [10]. (d) 2Fo – Fc (blue, contoured at 1.0σ) and Fo – Fc (red, contoured at 3.0σ) difference density maps calculated for [FeFe] hydrogenase at the site of one of the Fe–S clusters obtained from measurements on five large crystals [10]. (e) Positions of the atoms in the catalytic center of PS II as obtained from cryo SFX is shown in comparison to the positions obtained by SR experiments (blue spheres) [9]. (f) Radiation damage free omit map for the Fe Cu center of CoC showing the position of the peroxide ligand [11].

