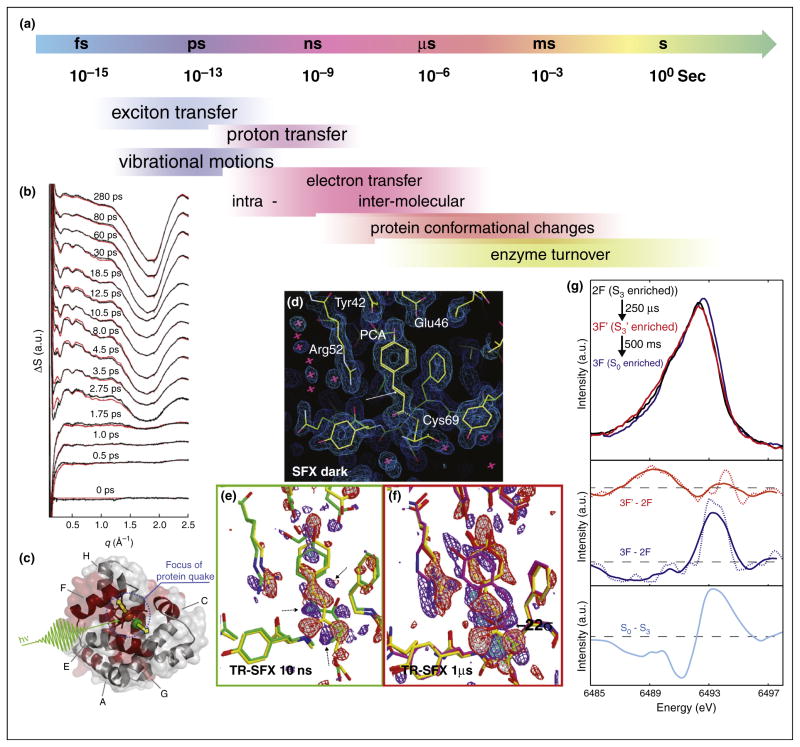
Figure 3.
Time resolved experiments using fs X-ray pulses at the CXI instrument at LCLS. (a) Timescales for dynamic processes in proteins/enzymes. (b) Time resolved WAXS measurements on the photosynthetic bacterial reaction center. Upon light excitation a ultrafast protein movements in the ps time regime was visible [44]. (c) Illustration of the protein-quake observed within a few ps in myoglobin upon photodissociation of CO [45], red shaded areas are involved in the movement leading to a volume increase of ~200 Å3. Time resolved serial femtosecond crystallography on photoactive yellow protein, showing the electron density for (d) the dark state as well as difference electron density for (e) data recorded 10 ns after light excitation and (f) 1 μs after light excitation. A movement of the S-atom of the chromophore is visible already in the 10 ns data (Adapted from [46]). (g) X-ray emission spectra of Mn in photosystem II. Spectra are shown for the 2F state (S3), as well as for a intermediate 250 μs after the 3rd light flash and 0.5 s after the 3rd light flash (S0-state). The difference spectra (middle panel) indicate a reduction in the S3-S0 transition (as expected from SR measurements — bottom panel), but no specific reduction is visible for the 250 μs state [31].

