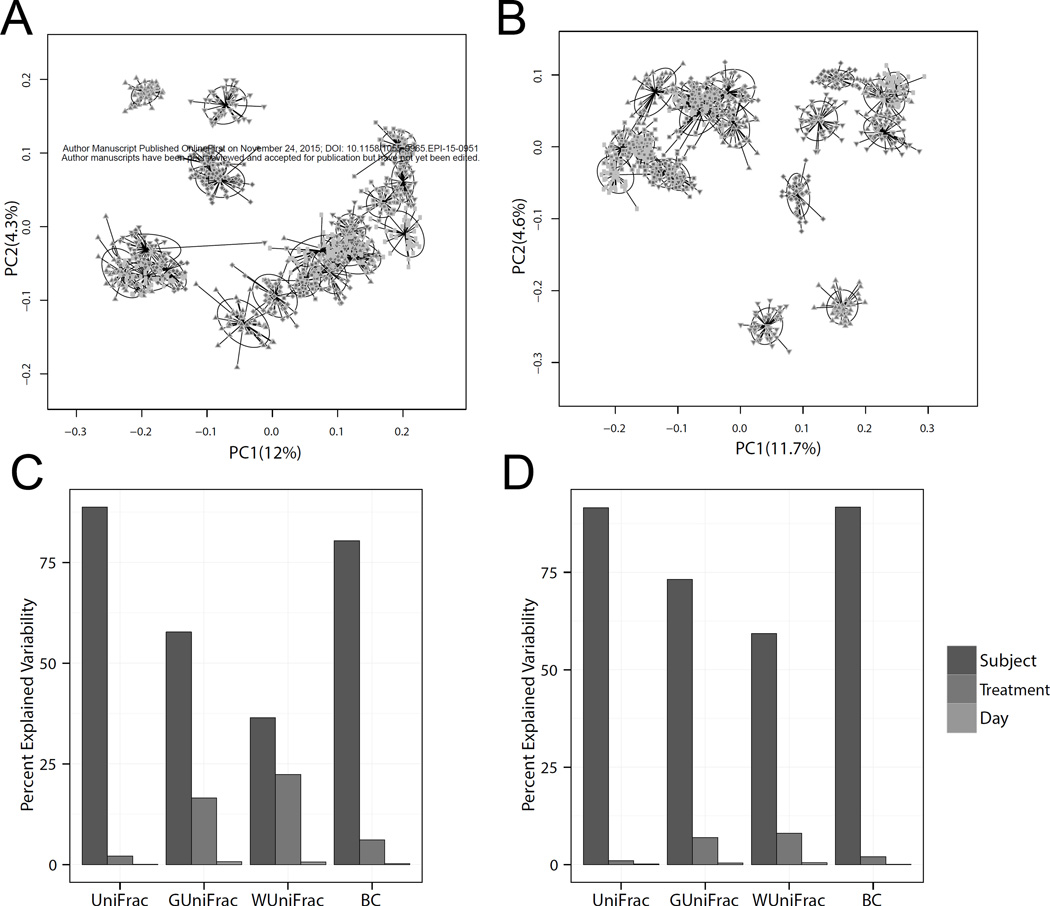
Figure 1.
Sources of microbiome variability. Principal coordinate plot based on unweighted Unifrac of the microbial community profiles from all samples analyzed in the Knight laboratory (A) and the Mayo Microbiome laboratory (B). A distance-based coefficient of determination R2 (unweighted Unifrac, generalized Unifrac, weighted UniFrac, and Bray-Curtis (BC) distance) was used to quantify the percentage of microbiota variability in the Knight laboratory (C) and the Mayo Microbiome laboratory (D).

