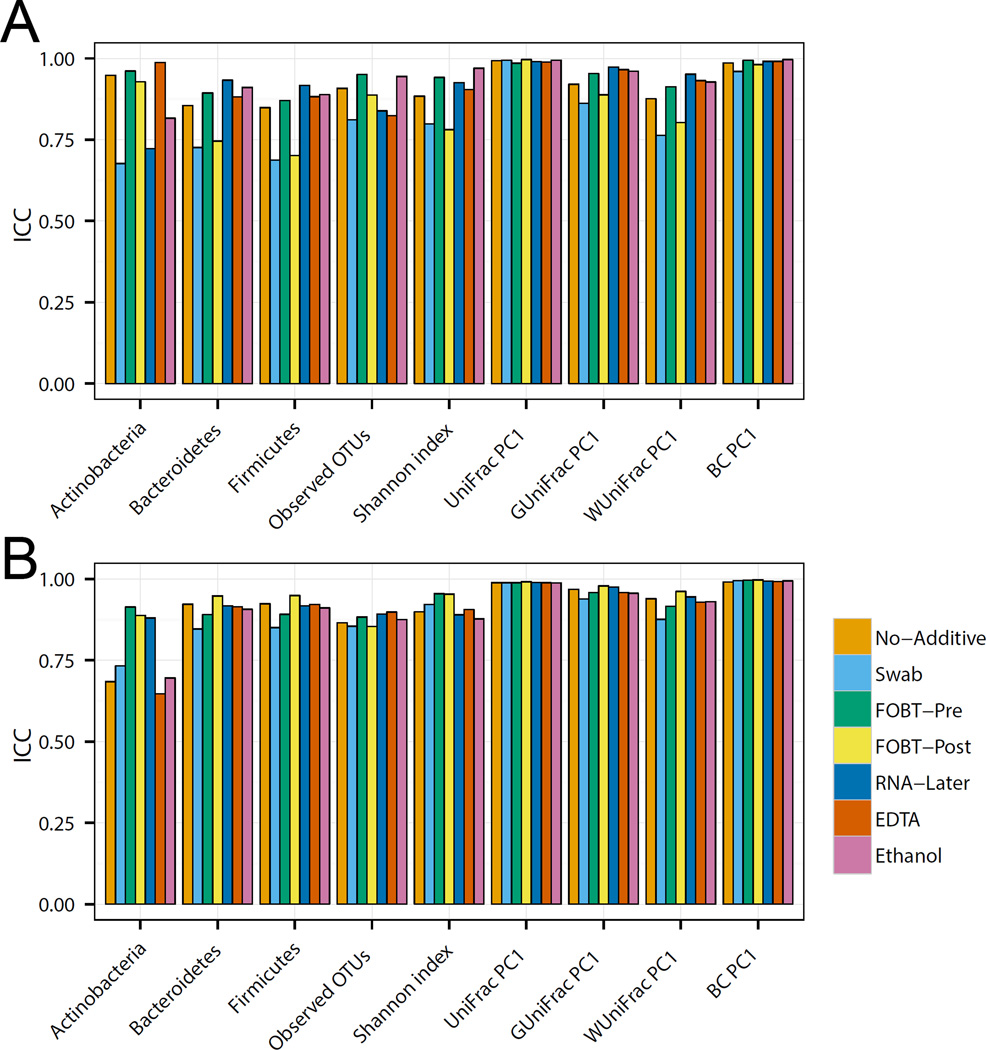
Figure 2.
Evaluation of technical reproducibility. Intraclass correlation coefficients for microbiome metrics including the abundance of three phyla, two alpha-diversity metrics (number of observed OTUs and Shannon index) and four beta-diversity metrics (top PCoA component for unweighted Unifrac, generalized Unifrac, weighted UniFrac, and Bray-Curtis distance) analyzed at day 0 in the Knight laboratory (A) and the Mayo Microbiome laboratory (B).

