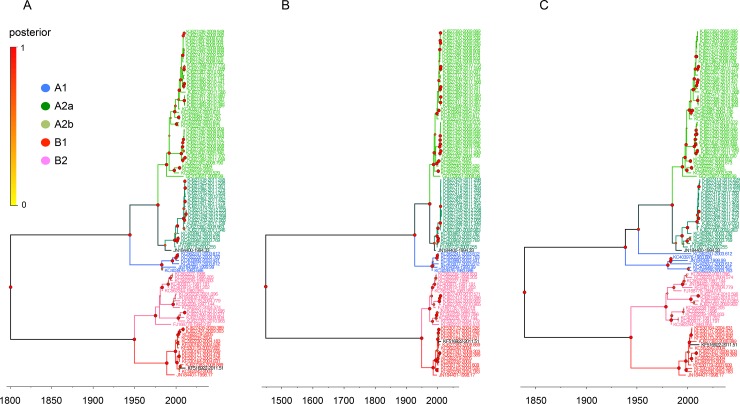
Fig 1. Phylogenetic relationships of HMPV N, P, and F gene sequences.
The relative phylogenetic relationships of HMPV N (A), P (B), and F (C) gene sequences were defined in time-framed maximum clade credibility (MCC) trees. The five different colors represent each lineage (blue, A1; green, A2a; lime, A2b; red, B1; and pink, B2). The genes of JN184400 and KF516922 are colored deep green and black, respectively. The isolation time point of each sequence is expressed as the year fraction at the end of the sequence accession number. As the color of circles in the tree nodes, the size of circles in the node represents the posterior probability of their clustering (the bigger size demonstrates the higher probability).

