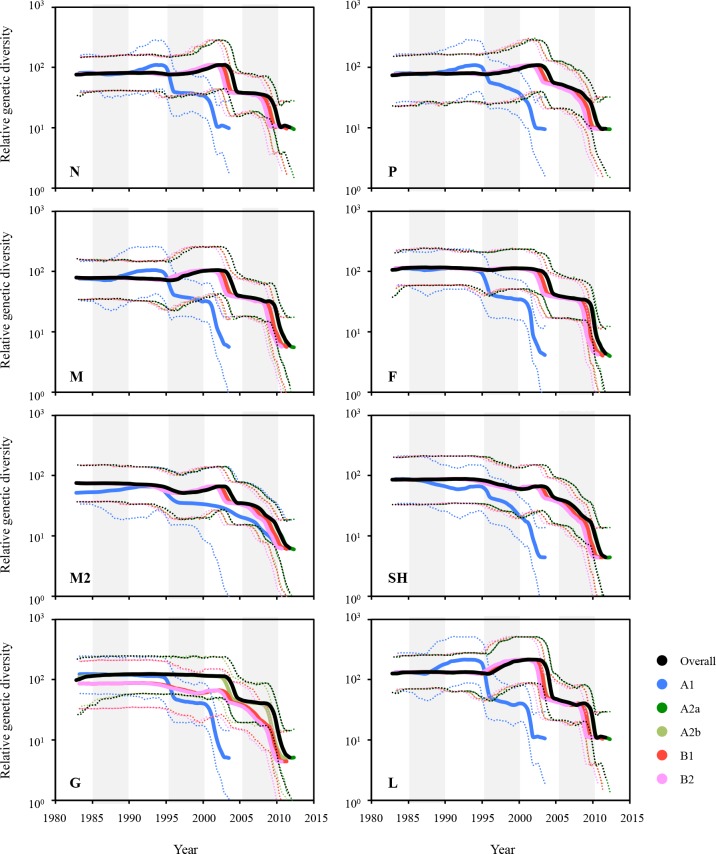
Fig 6. Population dynamics of HMPV sequences in skyline reconstruction plots.
The demographic inferences of HMPV genetic diversity were depicted using a Bayesian skyline reconstruction plot method. The plots for the eight genes were then reconstituted into the five lineages. Solid lines represent mean diversity, and dotted lines represent the lower and upper limits of the 95% HPD.

