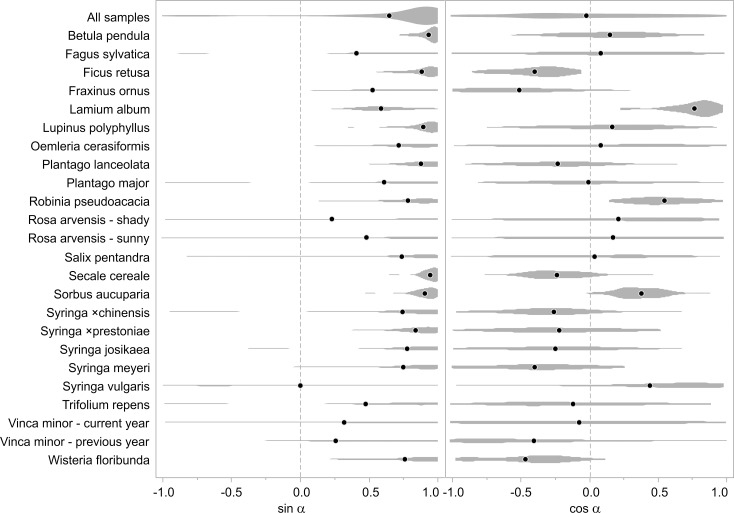
Fig 3. Values distribution of sine and cosine of the angles between shape-change vectors and the principal component 1 (PC1)-axis.
Mean values marked with black points. The sin α values correspond to direction of the vector along PC1-axis, while cos α values correspond to its direction along the PC2-axis. All sin α means are positive, which points out that there exists a strong generalised tendency of directional shape change toward lower values of PC1. No general trend has been detected in cos α values, although strong tendencies can be observed for some species.

