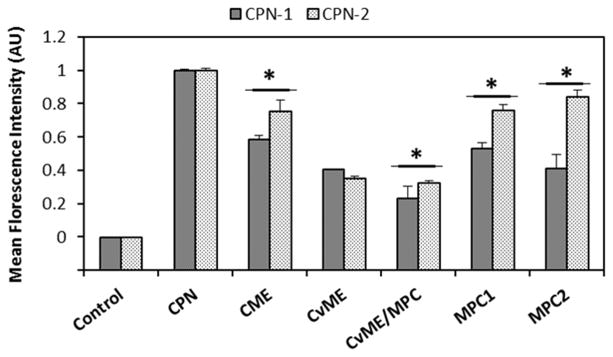
Fig. 5.
Endocytosis inhibition study under pharmacological inhibitors treatments. Mean fluorescence intensity of HeLa cell (Control), CPNs only (CPN), chlorpromazine (24 μM, CME), genistein (210 μM, CvME), methyl-β-cyclodextrin (1000 μM, CvME/MPC), LY294002 (120 μM, MPC1), and cytochalasin D (0.04 μM, MPC2) were measured using flow cytometry. Error bars represent standard deviation. *p < 0.05

