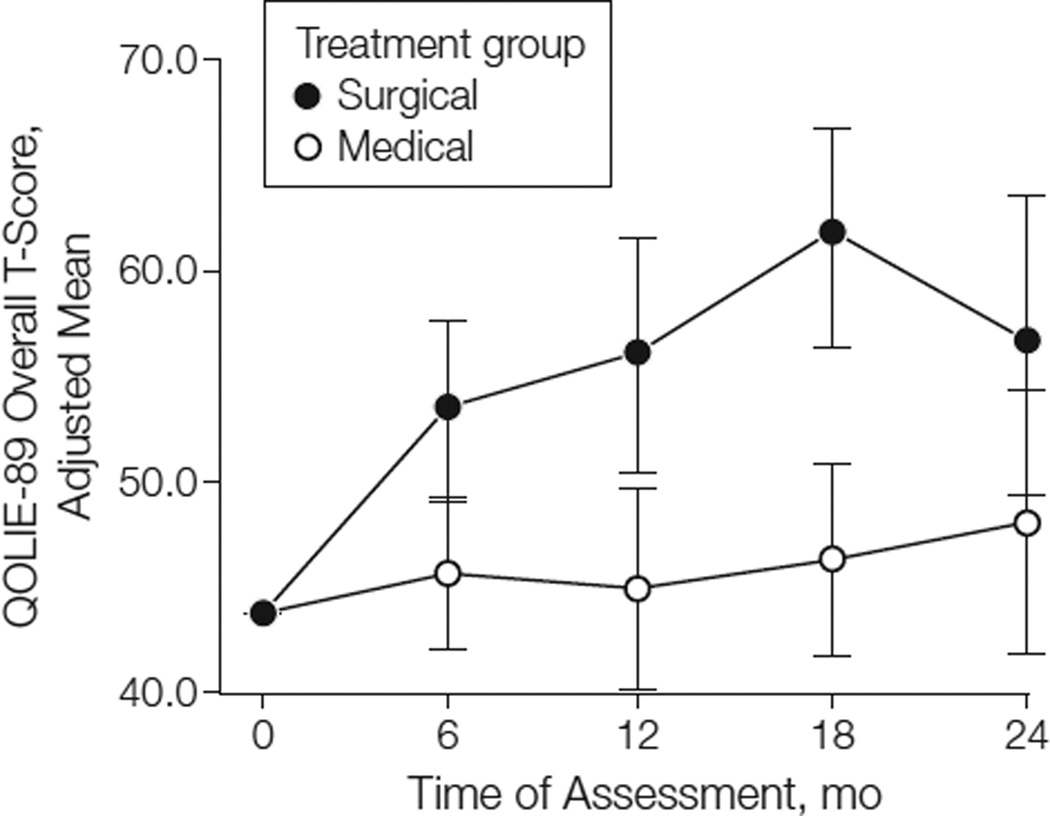
Figure 2.
Adjusted Mean QOLIE-89 Overall T-Score Over Time by Treatment Group
Bars indicate 95% CIs for the adjusted means. The adjusted means were obtained from a repeated-measures analysis of covariance model that included side of ictal onset and baseline Quality of Life in Epilepsy 89 (QOLIE-89) overall T-score as covariates.

