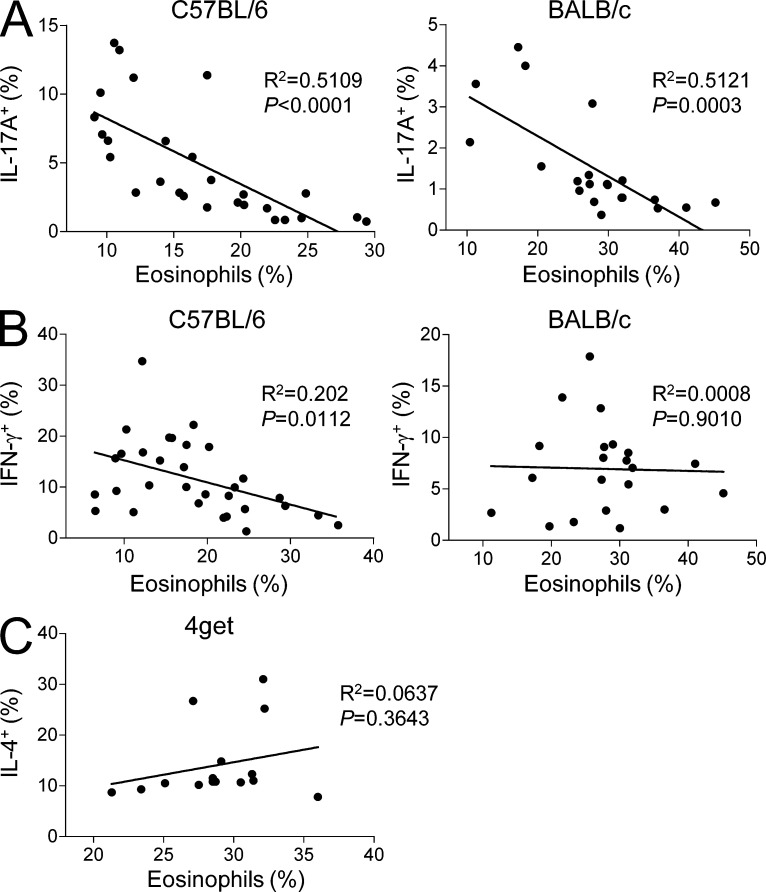
Figure 2.
Eosinophils are inversely correlated with Th17 cells in the small intestine. (A and B) Graphs show the correlation between the percentages of eosinophils and IL-17A+ Th17 (A) and IFN-γ+ Th1 cells (B) in the small intestine from C57BL/6 or BALB/c mice (n = 27 of C57BL6 [A] and 31 of C57BL/6 [B], and 21 of BALB/c [A] and 22 of BALB/c [B], respectively). (C) Graph shows the correlation between the percentages of IL-4+ Th2 cells and eosinophils in the small intestine from 4get mice (n = 15). The correlation coefficient was calculated by Prism software (GraphPad Software). Each dot represents one mouse. Mice with various ages (6–20 wk) and sex (female and male) were examined.

