Figure 5.
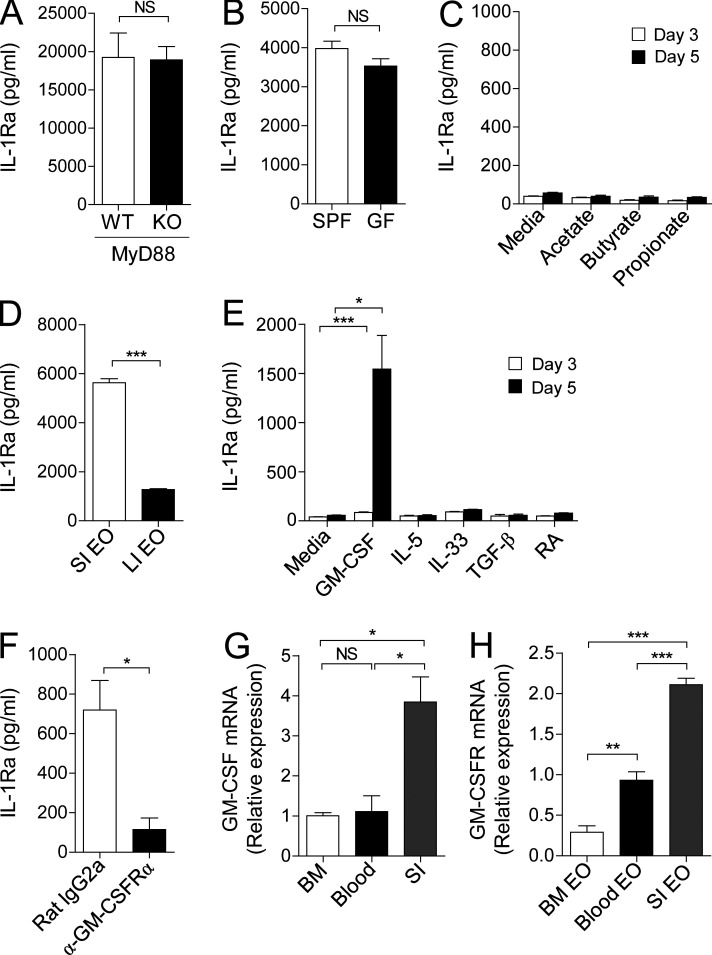
Eosinophils secrete IL-1Ra upon GM-CSF stimulation. (A and B) IL-1Ra in the culture supernatant of small intestinal eosinophils sorted from MyD88-deficient (KO; 105) or littermate control (WT; 105) mice (A) and SPF (5 × 10⁴) or GF (5 × 10⁴) mice (B) after a 24-h culture was measured by ELISA. (C) IL-1Ra in the culture supernatant of bone marrow eosinophils (2 × 10⁴) after a 3 or 5 d culture with acetate (1 mM), butyrate (1 mM), or propionate (1 mM) was measured by ELISA. (D) IL-1Ra in culture supernatant of eosinophils (5 × 10⁴) sorted from small intestine or large intestine was measured by ELISA. (E) IL-1Ra in the culture supernatant of bone marrow eosinophils (2 × 10⁴) after a 3 or 5 d culture with GM-CSF (10 ng/ml), IL-5 (10 ng/ml), IL-33 (10 ng/ml), TGF-β (5 ng/ml), or retinoic acid (RA; 10 mM) was measured by ELISA. (F) IL-1Ra in the culture supernatant of bone marrow eosinophils (1.5 × 10⁴) after a 5 d culture with GM-CSF (10 ng/ml) in the presence of GM-CSF receptor α blocking antibodies (α-GM-CSFRα; 8 µg/ml) or isotype control (Rat IgG2a; 8 µg/ml) was measured by ELISA. (G) Quantitative RT-PCR analysis of GM-CSF in bone marrow, blood, or jejunum (SI). (H) Quantitative RT-PCR analysis of GM-CSF receptor in eosinophils sorted from bone marrow, blood, or small intestine. All data are representative of at least three independent experiments. Bar graphs show the mean ± SEM. *, P < 0.05, ***, P < 0.001; NS, not significant (unpaired Student’s t test).

