Figure 6.
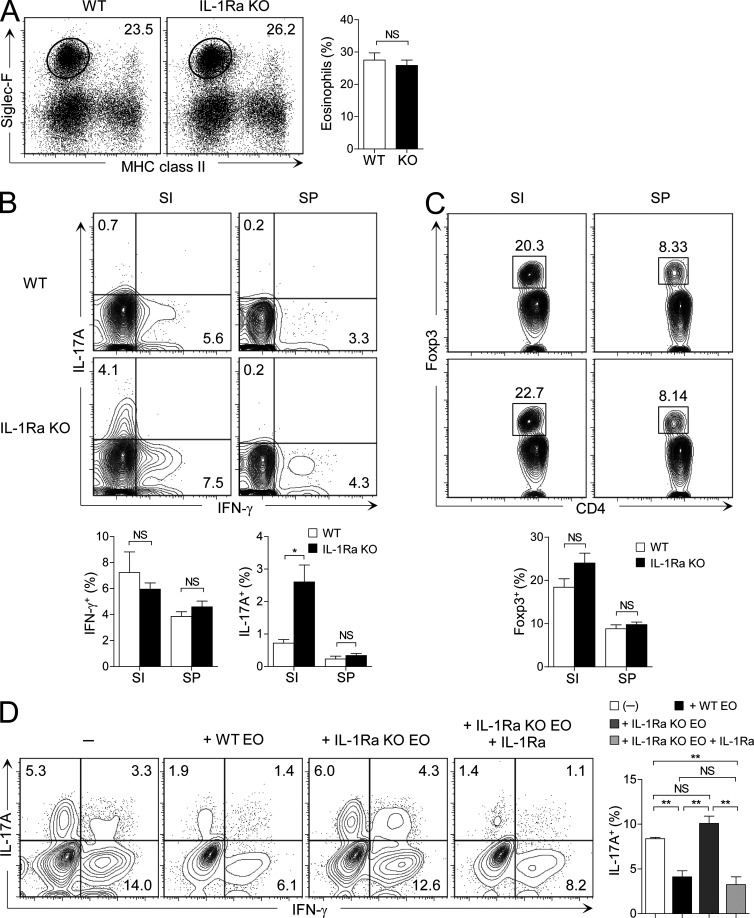
Small intestinal eosinophils suppress Th17 cells by producing IL-1Ra. (A) Flow cytometry analysis of the frequency of eosinophils in IL-1Ra–deficient (KO) or littermate control BALB/c mice (WT). FACS plots are representative of three independent experiments (n = 3 mice per group per experiment). Bar graphs show the mean ± SEM of pooled data. (B and C) Frequency of IFN-γ+ and IL-17A+ (B) and Foxp3+ (C) CD4+ T cells in the small intestine (SI) or spleen (SP) from IL-1Ra–deficient or littermate control BALB/c mice. FACS plots show cells gated on TCRβ+CD4+ cells and are representative of three independent experiments (n = 3−5 mice per group per experiment). Bar graphs show the mean ± SEM of pooled data. (D) Small intestinal CD4+CD25− T cells (105) and splenic DCs (104) were cultured with small intestinal eosinophils (105) from WT BALB/c or IL-1Ra–deficient mice in the presence of anti-CD3/CD28, neutralizing anti–IFN-γ, neutralizing anti–IL-4, neutralizing anti–IL-2, GM-CSF, TGF-β, IL-1β, and IL-23. IL-1Ra was added to certain cultures. After 5 d of culture, cells were collected and intracellular cytokine staining for IFN-γ and IL-17A in CD4+ T cells was analyzed by flow cytometry. FACS plots show cells gated on CD4+ T cells and are representative of four similar experiments. Bar graphs show the mean ± SEM. *, P < 0.05; **, P < 0.01. NS, not significant (unpaired Student’s t test).

