. 2016 Mar 7;213(4):535–553. doi: 10.1084/jem.20151100

Figure 3.

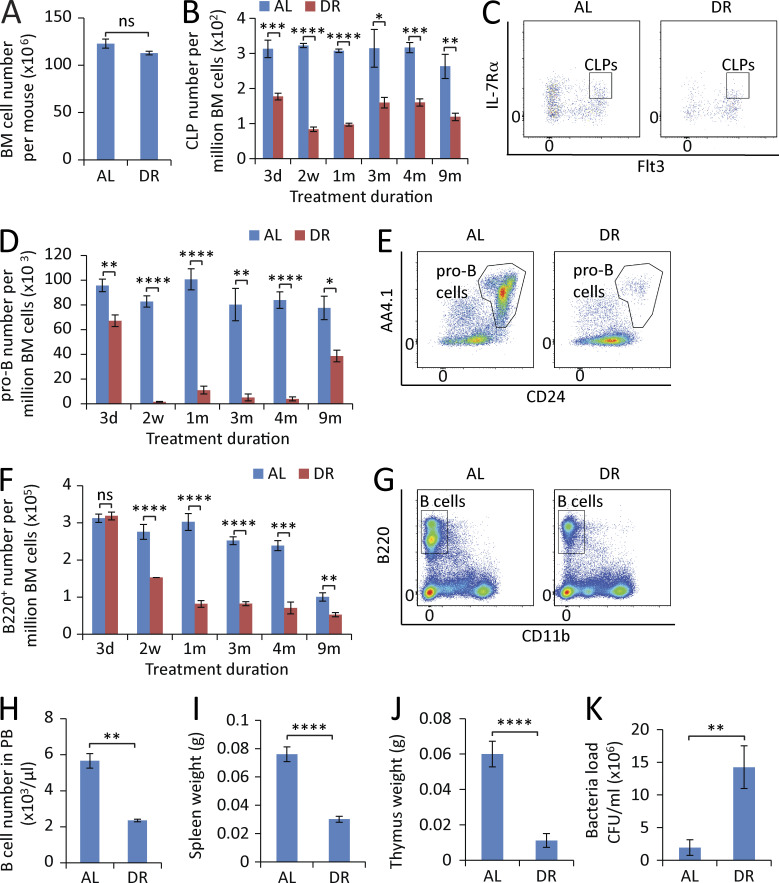
Figure 3. DR leads to a sequential reduction of lymphopoiesis in BM. (A) Total number of BM cells of mice treated with DR or AL for 2 wk (n = 5 mice per group; n = 2 independent experiments). (B, D, and F) Flow cytometry analysis of CLPs (B), pro–B cells (D), and B220+ cells (F) of BM from mice treated with DR or AL for the indicated time periods (n = 4–5 mice per group per time point; n = 2 independent experiments). Note a sequential reduction from early progenitors to downstream differentiated cells. (C, E, and G) Representative FACS plots at 2-wk time point gated from c-Kitmid/lowSca-1mid/lowlineage− cells (C), B220+TER-119−Gr-1−CD11b−CD3− cells (E), and total BM cells (G). (H–J) B cell counting in PB (H), spleen weight (I), and thymus weight (J) of mice treated with DR or AL for 2 wk (n = 5 mice per group; n = 2 independent experiments). (K) Mice were treated with a DR or AL diet for 10 d and injected with bacteria or vehicle control in the feet. Bacterial load was measured 1 wk after the bacterial injection (n = 6 mice per group; n = 2 independent experiments). CLPs, IL-7Rα+Flt3+c-Kitmid/lowSca-1mid/low lineage− cells; pro–B cells, B220+CD24+AA4.1+TER-119−Gr-1−CD11b−CD3− cells. Data are displayed as mean ± SEM. *, P < 0.05; **, P < 0.01; ***, P < 0.001; ****, P < 0.0001 by unpaired two-tailed Student’s t test. ns, not significant.

DR leads to a sequential reduction of lymphopoiesis in BM. (A) Total number of BM cells of mice treated with DR or AL for 2 wk (n = 5 mice per group; n = 2 independent experiments). (B, D, and F) Flow cytometry analysis of CLPs (B), pro–B cells (D), and B220+ cells (F) of BM from mice treated with DR or AL for the indicated time periods (n = 4–5 mice per group per time point; n = 2 independent experiments). Note a sequential reduction from early progenitors to downstream differentiated cells. (C, E, and G) Representative FACS plots at 2-wk time point gated from c-Kitmid/lowSca-1mid/lowlineage cells (C), B220+TER-119Gr-1CD11bCD3 cells (E), and total BM cells (G). (H–J) B cell counting in PB (H), spleen weight (I), and thymus weight (J) of mice treated with DR or AL for 2 wk (n = 5 mice per group; n = 2 independent experiments). (K) Mice were treated with a DR or AL diet for 10 d and injected with bacteria or vehicle control in the feet. Bacterial load was measured 1 wk after the bacterial injection (n = 6 mice per group; n = 2 independent experiments). CLPs, IL-7Rα+Flt3+c-Kitmid/lowSca-1mid/low lineage cells; pro–B cells, B220+CD24+AA4.1+TER-119Gr-1CD11bCD3 cells. Data are displayed as mean ± SEM. *, P < 0.05; **, P < 0.01; ***, P < 0.001; ****, P < 0.0001 by unpaired two-tailed Student’s t test. ns, not significant.