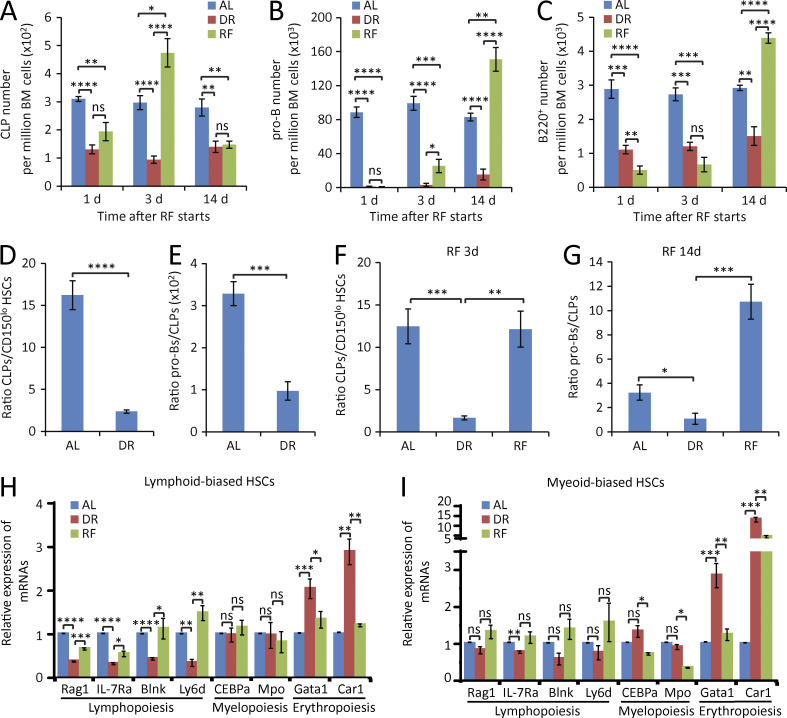
Figure 5.
DR impairs lymphoid cell differentiation and enhances erythropoiesis in lymphoid-biased HSCs. (A–C) Mice were treated with DR or AL for 3 wk. Afterward, half of the mice in the DR group were refed AL (RF), whereas the remaining mice were continuously treated with the same diet as before. The numbers of CLPs (A), pro–B cells (B), and B220+ cells (C) in BM were analyzed by flow cytometry at the indicated time points after RF (n = 5 mice per group per time point; n = 2 independent experiments). One-way ANOVA analysis was used. Note that a sequential recovery occurred first in CLPs, second in pro–B cells, and lastly in B220+ cells after RF. (D and E) Flow cytometry analysis of the ratio of CLPs versus lymphoid-biased HSCs (D) and pro–B cells versus CLPs (E) of BM from mice treated with DR or AL for 1 mo (n = 5 mice per group; n = 2 independent experiments). Unpaired two-tailed Student’s t test was used. (F–I) Mice were treated with DR or AL for 3 wk. Afterward, half of the mice in the DR group were refed AL for 3 or 14 d, whereas the remaining mice were continuously treated with the same diet as before (n = 5 mice per time point per group; n = 2 independent experiments). One-way ANOVA analysis was used. (F) Ratio of CLPs versus lymphoid-biased HSCs after RF for 3 d. (G) Ratio of pro–B cells versus CLPs after RF for 14 d. (H and I) The expressions of lymphoid-, myeloid-, and erythroid-specific genes in lymphoid-biased HSCs (H) and myeloid-biased HSCs (I) were analyzed by qRT-PCR after RF for 3 d (n = 3 independent experiments). For each experiment, HSCs were obtained from a pool of three to four mice per group. Data are displayed as mean ± SEM. *, P < 0.05; **, P < 0.01; ***, P < 0.001; ****, P < 0.0001. ns, not significant.

