
Figure 2.
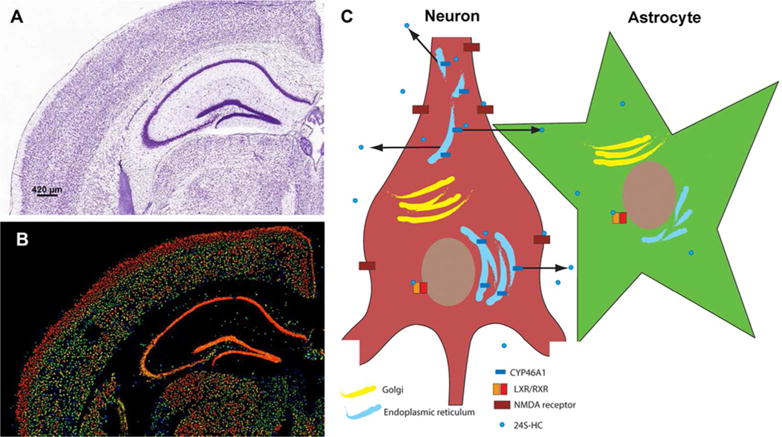
Nissl stain (A) and expression heat map for CYP46A1 mRNA expression (B) in coronal brain sections of mouse, showing strong neuronal expression. Images are taken from the Allen Brain Atlas, ©2014 Allen Institute for Brain Science. Allen Mouse Brain Atlas, available from http://mouse.brainmap.org/. C. Schematic of neuronal production of 24S-HC from endoplasmic reticulum and subsequent release. For simplicity, interaction of 24S-HC with only two targets is shown: LXR/RXRs of neurons and astrocytes and NMDARs on neuronal plasma membrane.