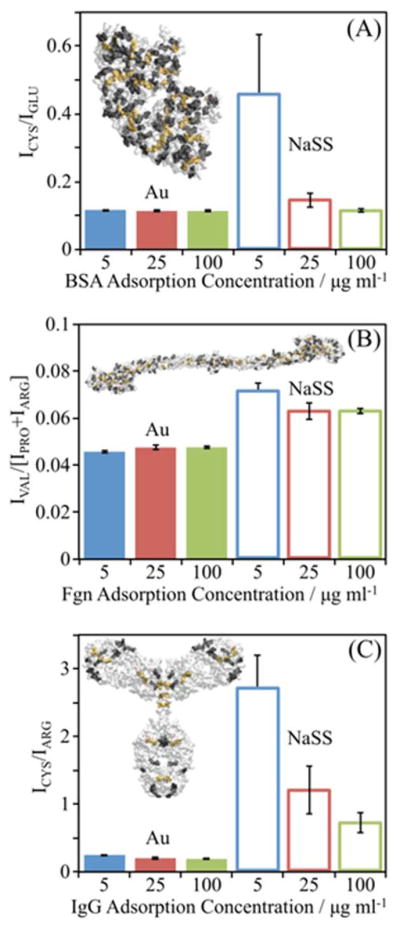
Figure 4.

ToF-SIMS peak intensity ratios suggest levels of denaturation of (A) BSA, (B) Fgn, (C) and IgG adsorbed onto gold and NaSS surfaces. Insets show the crystal structure of each protein. Bars represent mean amino acid peak ratios for proteins adsorbed from 5 (blue), 25 (red), and 100 (green) μg/ml solutions onto Au surfaces (solid bars) or NaSS surfaces (open bars). Peak ratios are the sum of intensities of secondary ions from amino acids buried, highlighted in yellow in inset protein, divided by the sum of intensities from amino acids on the surface of the protein, highlighted in black. Error bars represent standard deviations.
