
Figure 3. Graphical illustration of the main findings of the present study and plausible physiological interpretation.
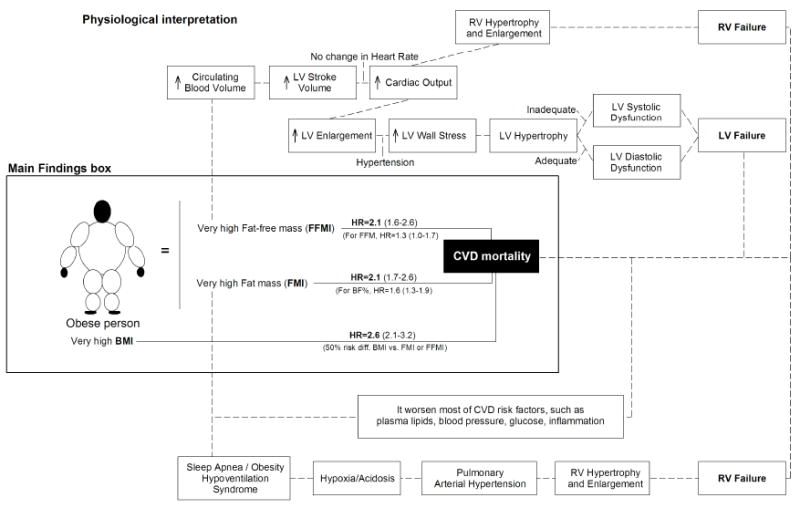
BMI indicates body mass index; BF%, percent body fat; FMI, fat mass index; FFM, fat-free mass; FFMI, fat-free mass index; CVD, cardiovascular disease; LV, left ventricular; RV, right ventricular. Part of the physiological interpretation shown is adapted with permission from Lavie et al. 30. More detailed information about obesity and its relationship with pathophysiology and hemodynamics of CVD is provided elsewhere 1,30,39.