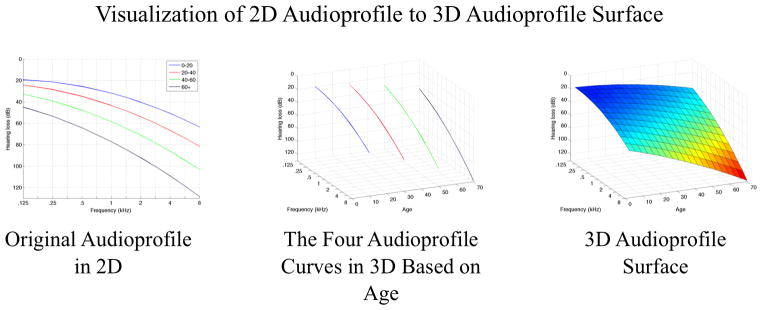
Figure 1.
Comparing two-dimensional to three-dimensional audioprofiles. The relationship between audioprofiles and the audioprofile surface (APS) is shown, using simulated audiograms for illustrative purposes. The APS represents average thresholds as a function of frequency and age for a specific genetic type of hearing loss. By plotting the APS in three dimensions, differences in rate of change of thresholds with frequency and age are easily appreciated. As a clinical tool, by plotting an audiogram on an APS, it becomes possible to compare a specific patient’s data with average thresholds in the context of that particular genetic type of hearing loss. Prognostic information, such as rate of progression of hearing loss, is readily apparent and easily interpreted.

