Figure 2.
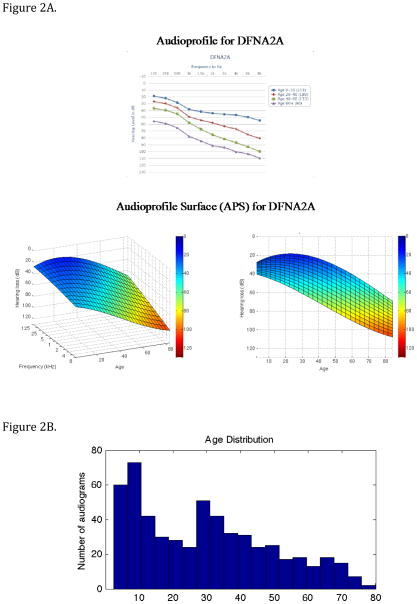
Figure 2A. Comparison between a multi-age composite audioprofile and APS for DFNA2 (KCNQ4). The color redundantly indicates the severity of hearing loss for the APS. Note that the two-dimensional representation of the three-dimensional APS clearly illustrates that KNCQ4 hearing loss is greatest in the high frequencies.
Figure 2B. Age distribution of patients used to generate the DFNA2A APS in 2A. Most age groups included audiograms on at least 20 persons, with a skew towards the younger age groups.

