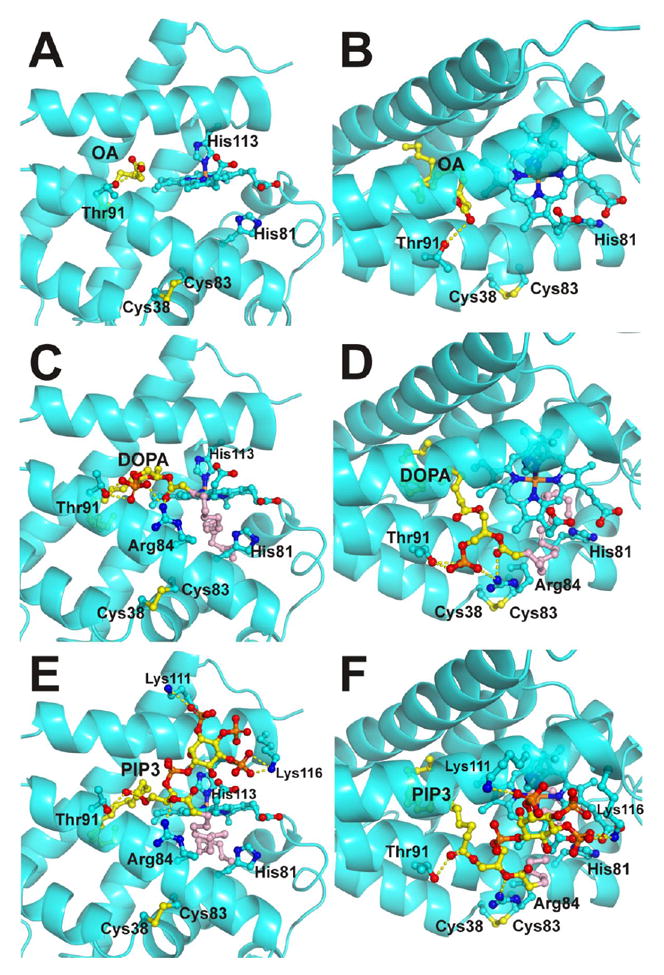
Figure 8. Binding models for cytoglobin and OA, DOPA and PIP3.

Panels A and B, predicted binding model for OA. The aliphatic chain extends into the hydrophobic core of the protein; the carboxylate group interacts with the Thr91 side chain. Panel A shows the view from the heme plane. Panel B shows a top view. Panels C and D, predicted binding model for DOPA. Panel C, view from the heme plane; Panel D, top view. The model shows Thr91 and Arg84 stabilizing the phosphate group of DOPA; one oleic chain extends into the hydrophobic core of the protein (yellow) whereas the other hydrophobic chain is either interacting with the solvent or occupying a secondary binding site in the distal heme pocket (pink). Panels E and F, predicted binding model for PIP3. Panel E, view from the heme plane; Panel F, top view. The phosphate groups of PIP3 are shown interacting with Lys111 and Lys116. Arg84 and Thr91 interact with the ester groups from the FA chains. The phosphate group missing in PIP2 is the phosphate group interacting with Lys 116. As observed in the DOPA models, one oleic chain extends into the hydrophobic core of the protein (yellow) whereas the other hydrophobic chain is either interacting with the solvent or occupying a secondary binding site in the distal heme pocket (pink). The lipids, heme group and selected Cygb residues are shown as ball and sticks. Lipid carbon atoms are shown in yellow/pink, heme and Cygb side chain carbon atoms are shown in cyan.
