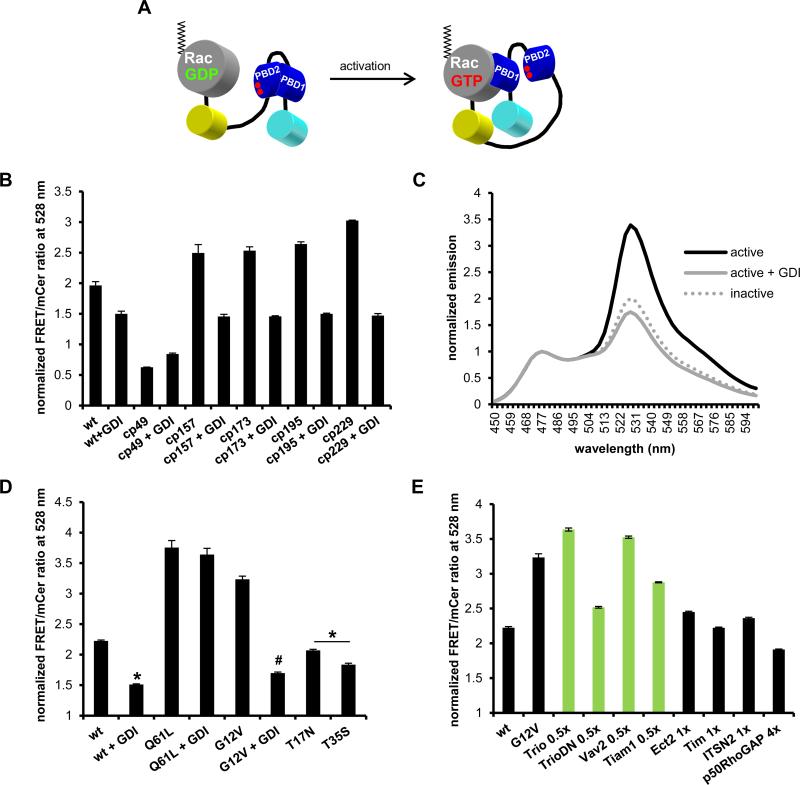
FIGURE 1.
Rac1 biosensor optimization. A) Single-chain Rac biosensor design showing inactive low FRET (left) versus active high FRET states (right). Red dots in PBD2 domain indicate GTPase-binding mutations H83D, H86D. B) Optimization of WT Rac1 biosensor with circular permutations cp49, cp157, cp173, cp195 and cp229 of mVen with or without excess GDI. C) Emission spectra of constitutively active (G12V) with or without excess GDI and dominant negative (T17N) Rac1 biosensor with mcp229Ven, normalized to mCer1 emission peak at 474 nm. D) WT or mutant GTPase versions of mcp229Ven Rac1 biosensor in the presence or absence of excess GDI. E) WT GTPase version of mcp229Ven Rac1 biosensor co-expressed with Rac1-targeting (in green) or non-targeting GEFs (no GDI) and Rac1-targeting p50RhoGAP. Fluorometry data, performed in HEK293 cells, are the mean +/− SEM of 3 independent experiments performed in triplicates. * p < 0.0001 vs WT alone; # p < 0.00001 vs G12V alone.

