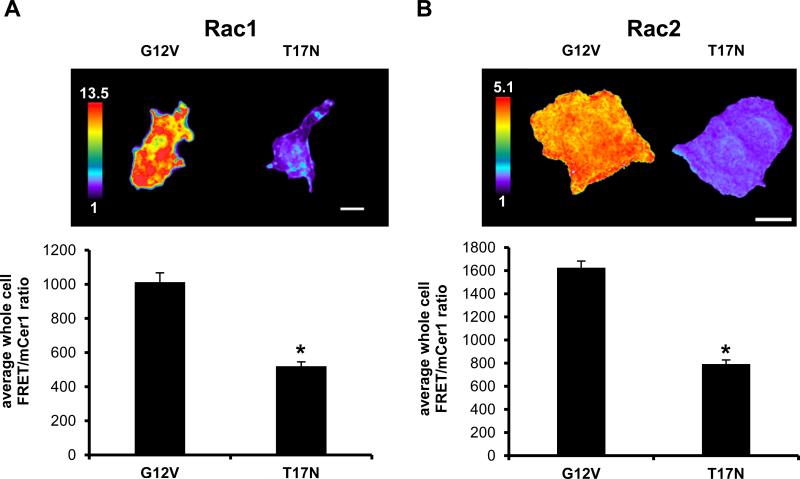
FIGURE 3.
Validation of Rac1 and Rac2 biosensors in macrophages. A) Ratiometric images of transiently overexpressed constitutively active (G12V) or dominant negative (T17N) Rac1 and B) Rac2 biosensor (with mcp229Ven) in RAW/LR5 cells. Scale bar = 10 μm. Bar graphs are quantitation of whole cell levels of Rac activity, n = at least 15 cells/condition, mean +/− SEM, p < 0.00001.

