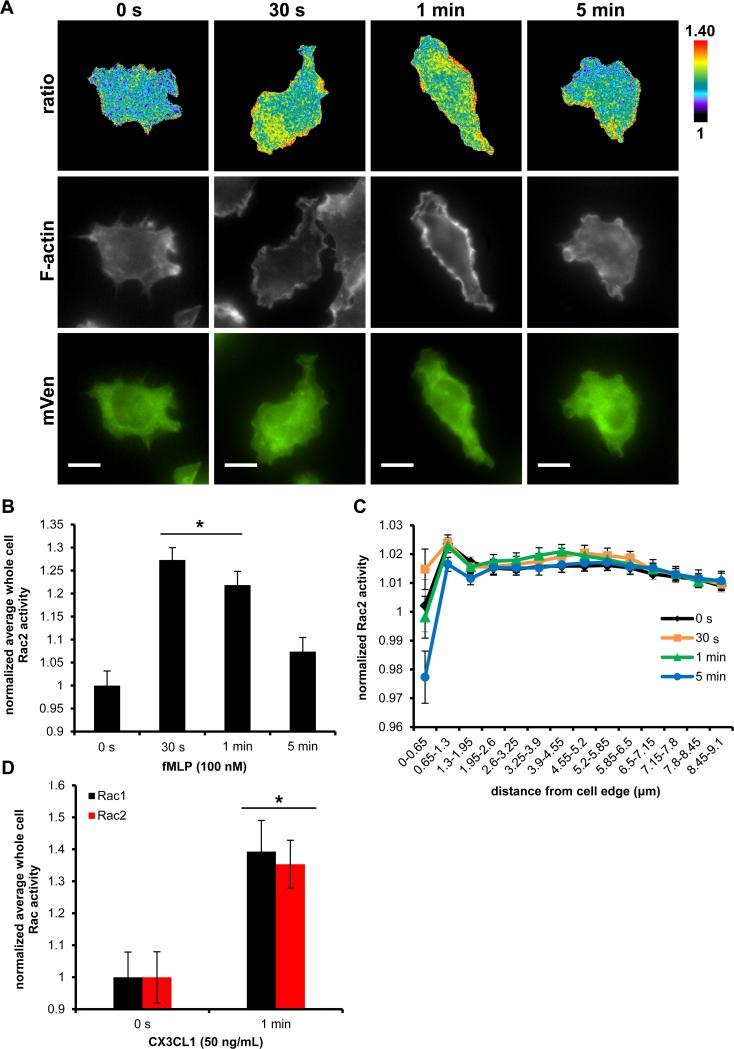
FIGURE 5.
Rac2 activation dynamics during fMLP response by macrophages. A) Representative ratiometric images (top panel) of FMLPR.2 cells transiently expressing WT Rac2 biosensor stimulated with 100 nM fMLP for indicated times, stained for F-actin (middle panel) and mVen emission to confirm biosensor expression (bottom panel); scale bar = 10 μm. B) Quantitation of whole cell levels of Rac2 activity; * p < 0.0001 vs 0 s. C) Quantitation of Rac2 activity at the cell edge by radial edge-erosion analysis, where activity was normalized to the lowest value (center region of the cell) within each time point to show relative edge activity. Data are the mean +/− SEM from 3 independent experiments, ≥ 15 cells/time point/experiment. D) Quantitation of whole cell levels of Rac1 and Rac2 activity in RAW/LR5 cells transiently expressing Rac1 or Rac2 biosensor and stimulated with 50 ng/mL CX3CL1 for 1 min. Data mean +/− SEM of n = 12 cells, p < 0.005.

