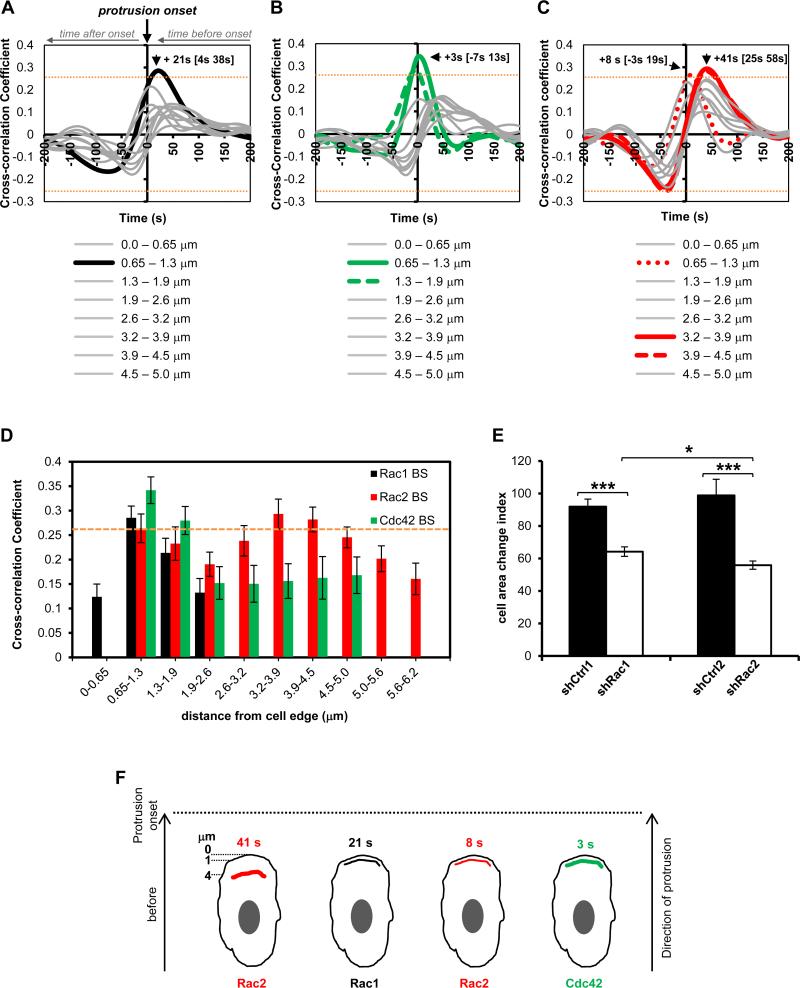
FIGURE 9.
Morphodynamic analysis of Rac1, Rac2 and Cdc42 activation dynamics during random protrusions of macrophages. Temporal cross-correlation of GTPase activation relative to edge velocity, arrows showing peak activation times for A) Rac1 B) Cdc42 and C) Rac2. Data from n=733 windows from 25 cells for Rac1, n=520 windows from 19 cells for Cdc42, and n=778 windows from 29 cells for Rac2. Orange dashed line indicates that cross-correlations above 0.2552 or below −0.2552 are significant with p < 0.05. Gray lines indicate non-significant correlations. See text for additional statistical values for morphodynamic analysis. D) Spatial dependence of temporal cross-correlation of GTPase activation as a function of distance from the edge of the protrusion (data extracted from panels A-C). E) Cell area change index for shRac1 and shRac2 macrophages and their respective controls, shCtrl1 and shCtrl2; data mean +/− SEM, * p = 0.0352, *** p < 2.5 × 10⁻⁶, shCtrl1 = 127 cells, shRac1 = 119 cells, shCtrl2 = 69 cells and shRac2 cells = 101 cells from 3 independent experiments and at least 5 individual fields/experiments. F) Model of Rho GTPase activation dynamics in random protrusions of macrophages showing that Rac2 is activated first in a 3.2-4.5 μm region 41 s before protrusion onset, followed a second pool of Rac2 activation right behind the leading edge, in parallel with Rac1 and Cdc42, at indicated times before protrusion onset.

