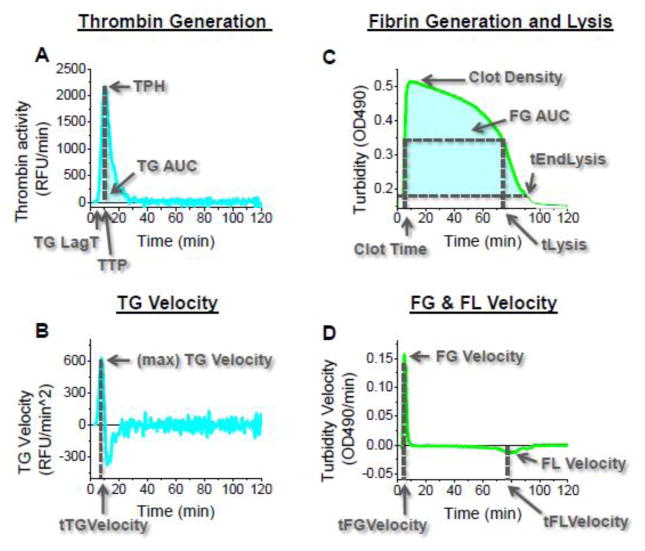
Figure 1. Parameters used for TG curve and FG/FL curve quantification in this paper.
Parameters quantifying TG, FG, and FL are calculated from the raw fluorescence and absorbance curves and their derivatives. Times and magnitudes where the TG (change in fluorescence over time) and FG/FL (absorbance with respect to time) curves rise from their baselines, reach their maxima, and for FL, fall back toward the starting baseline are analyzed for their response to different TF and tPA concentrations, as are the areas under the TG and FG/FL curves.

