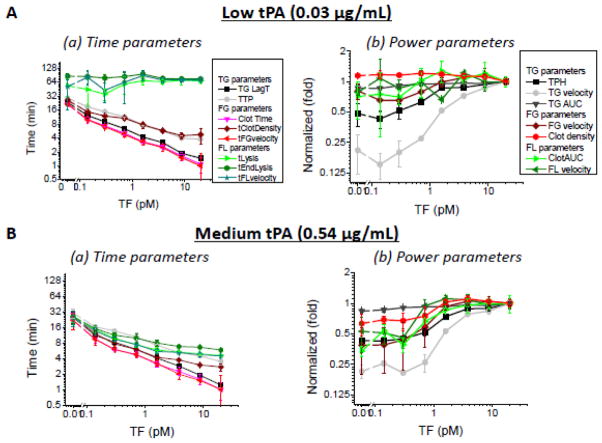
Figure 4. Similarity of trends for 15 different TG/FG/FL parameters at low and medium tPA concentrations in normal plasma.
Experiments in normal plasma (n = 3) without TM, CTI, or CPI. TF range spanned from 0.14–20 pM; concentration of tPA was either 0.03 μg/ml (A) or 0.54 μg/ml (B). Power parameters are shown relative to their values at 20 pM TF.

