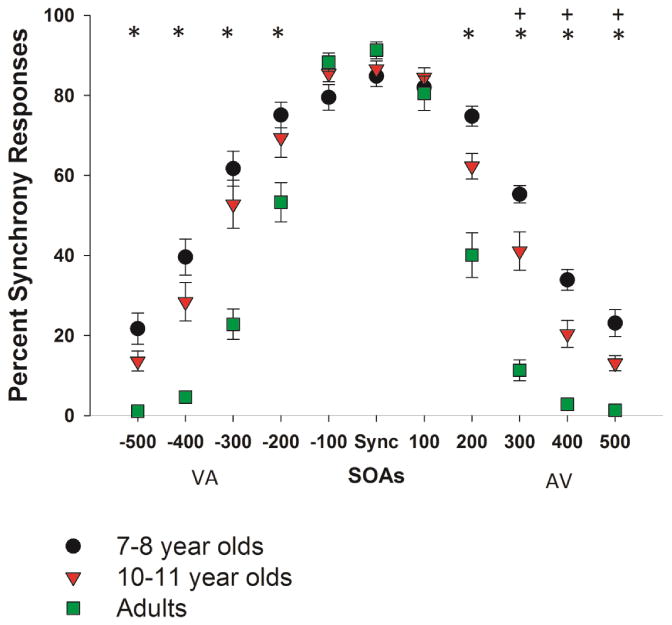
Figure 2. Synchrony Perception at Different SOAs.

Percent of synchronous responses for each group at each SOA is shown. Asterisks (*) at the top of the figure mark all SOAs at which adults were more sensitive to asynchrony than either group of children. Pluses (+) mark all SOAs at which 10-11 year old children were more sensitive to asynchrony than 7-8 year old children. Error bars represent standard errors of the mean.
