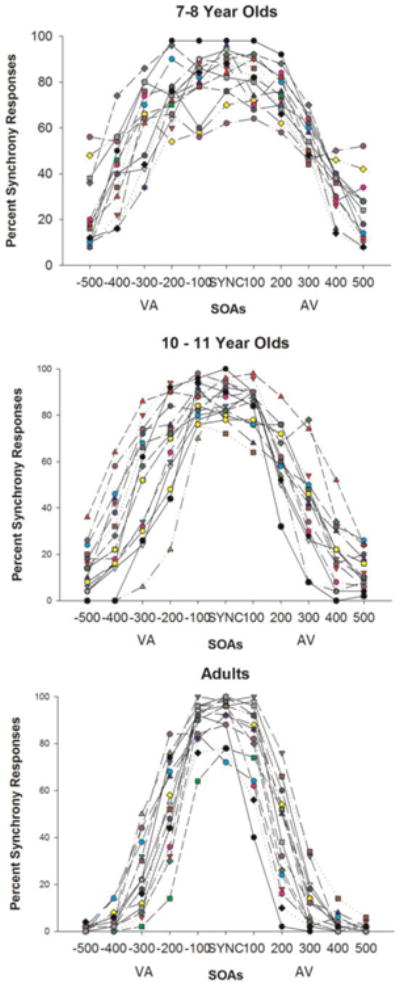
Figure 3. Individual Differences in Sensitivity to Audiovisual Asynchrony.

Percent of synchronous responses provided by each participant in each group is shown for all SOAs. Note a significant reduction in individual variability of responses at the two longest SOAs (400-500 ms) in adults compared to either group of children. Also of note is a high degree of individual variability in adults at the 200 and 300 ms SOAs.
